Small disclosure
I am doing a course that requires learning statistics but it is not my field of expertise so I may make several mistakes, apologies in advance. Also, I will add some background as suggested, but the question is at the end of the post if someone does not want to read everything.
The Dataset
I have a large dataset I got from Kaggle with 8000 observations of different individuals. Each individual has 4 binomial attributes (so 1 or 0), i.e. Male (1) or Female (0). There are 5 other columns with continuous variables, i.e one is "average number of characters per post".
What I am trying to understand
I wanted to see if for each of these continuous variables there were significant differences among the different groups (so for each attribute).
Process
This is where I am less confident about. I thought it would make sense to do the non-parametric Mann-Whitney U Test to compare each group. However, since I am comparing 4 pairs of categories simultaneously, I thought that it would be sensible to adjust the obtained p-values to prevent an increased risk of committing a type 1 error. So I thought of using the Bonferroni correction (if this makes sense...)
The results
So I decided to start comparing Group A and Group B for the category "Average Number per Posts". The Mann-Whitney Test gives me the following statistic and p-value: Statistics=-25707067.000, p=0.000
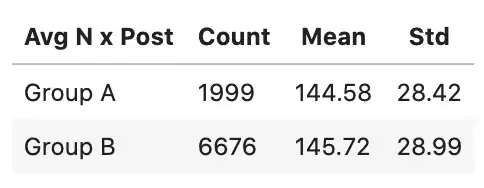
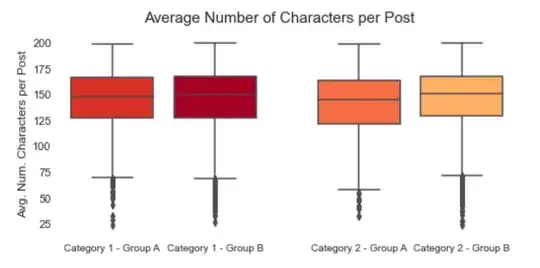
The problem is that when I look at the data, this result seems to be very far fetched, here are some descriptive statistics and a box plot:
For me, the groups are almost identical, I would have guessed that I would not have found grounds to reject the null hypothesis.
Question
I am a bit lost trying to understand the reason behind these results. With such a large sample, can these minor differences give a significant p-value? I guess that statistical significance does not mean that something is relevant in real life but are these results possible or most likely a consequence of a mistake I made in the process? Should I have done something different?
Possible mistakes?
- Result of a bad study design and statistical process
- Result of bad programming (this will be impossible for you to determine but I guess it's possible)
- Correctly computed but misinterpretation of the results
- Combination of the previous or other
Any way, thanks and sorry for the long post.

