1

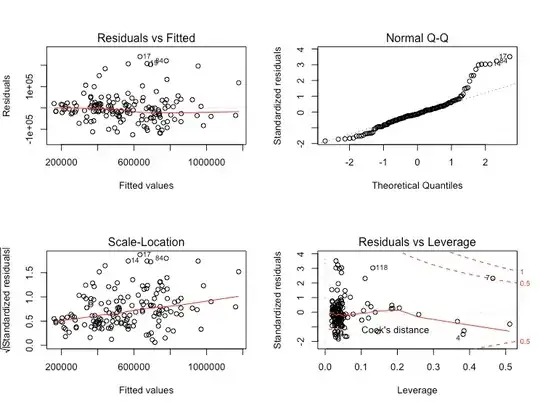
I have residual plots like the following:

enter image description here

Should I be concerned about the large hump for the higher quantiles on the normal Q-Q plot? Would some sort of a transformation on the response variable help? I am unsure where to go to now. My model is significant.
gung - Reinstate Monica
  • 132,789
  • 81
  • 357
  • 650
324
  • 484
  • 2
  • 8
  • The scale location plot shows variance increasing with mean and the plot of residuals and leverage show a number of points with high leverage. I would sort out why you are seeing the outlying points first before investigating transformation. Without more details about your model it is impossible to give a more helpful answer. – mdewey Jul 26 '20 at 12:37

1 Answers1

1

The Q-Q plot is showing positive skew. R package trafo is designed to show how transforms affect model assumptions.

Comparing the untransformed model with a transformed model (the default is the Box-Cox transformation) is done as follows:

R> linMod_trafo <- trafo_lm(linMod)
R> diagnostics(linMod_trafo)
R> plot(linMod_trafo)

See the R Journal Vol. 11/2, December 2019 for a nice explanation.

gung - Reinstate Monica
  • 132,789
  • 81
  • 357
  • 650
Single Malt
  • 504
  • 1
  • 5
  • 15