2

When using random variables in most programming languages the usual process is based on instatiating a RandomGenerator which will output an stream of pseudo-random numbers and with this stream the rest of distributions can then be calculated.

My questions are:

  1. Why sampling random variables sequencially alters the original sequence?

To illustrate the point, this behaviour can be reproduced with the following code in Python:

import numpy as np
sample_size = 5

np.random.seed(seed)
a = []
for _ in range(sample_size ):
    a.append(np.random.rand())

np.random.seed(seed)
b = []
for _ in range(sample_size ):
    b.append(np.random.rand())
    np.random.normal()

print(a)
print(b)
print(np.isin(b, a).mean())

As one can see in the code, drawing normally distributed samples altered the distribution of the uniform distributed samples. Moreover, the proportion of common elements between b and a tends to be 0.44 as the sample size increases for some reason.

This leads to a second question:

  1. Where this 0.44 comes from? Why is it different depending on the distribution used as auxiliary? (0.5 for exponential, 0.20 for beta, etc.)

EDIT: The question was too general at the beginning and thus I decided to split the question into two in order to select a proper answer. The follow up question is available here.
2 Answers2

1

Without going into unnecessary details, let's think about the pseudo random number generator (PRNG) as a black-box function. Witht given seed, PRNG would always generate the same series of values. Say that your PRNG generates standard uniform values, then after setting the seed your samples are

$$ u_1, u_2, u_3, u_4, u_5, u_6, \dots $$

If you only generated uniform samples:

for _ in range(sample_size ):
    b.append(np.random.rand())

the results for $a$ and $b$ would be the same. If you used another draw from uniform distribution, i.e.

for _ in range(sample_size ):
    b.append(np.random.rand())
    np.random.rand()

then for the array $b$ you are "dropping" (second call to np.random.rand) every second $u_i$ value, i.e.

$$\begin{align} &a = (u_1, u_2, u_3, u_4, u_5, u_6, \dots )\\ &b = (u_1, \quad\, u_3, \quad\, u_5, \quad \dots )\\ \end{align}$$

In case of other distributions, the result depends on how they are generating the samples.

For example, if you are using Box-Muller algorithm for generating samples from normal distribution, than you use two uniform samples per two normal samples

$$ X = \sqrt{- 2 \ln U} \, \cos(2 \pi V) , \qquad Y = \sqrt{- 2 \ln U} \, \sin(2 \pi V) . $$

so when generating only one sample at a time, you are wasting every third $u_i$ value, so it would be as if you were doing this:

for _ in range(sample_size ):
    b.append(np.random.rand())
    U = np.random.rand()
    V = np.random.rand()

For exponential distribution, you can use inverse transform method, so you are dropping every second uniform sample. To generate sample from beta distribution, you need two samples from gamma distribution, where depending on algorithm, each of those needs from one to three uniform samples, etc.

Of course, in many cases there are multiple algorithms for generating random samples from a distribution, I'm not saying that Numpy uses those algorithms (you'd need to check the source code). If it used different algorithms, the patterns would be different.

So the consequence is that every $n$-th value in the $b$ array would be repeated in $a$ at the $i-n$ position. The length of the cycle would depend on what exactly you are doing.

As a side note, if I'm not mistaken np.isin checks for equality, so this is not something you should use to compare floating point numbers.

Tim
  • 108,699
  • 20
  • 212
  • 390
  • Thank you Tim, that answers the fourth question but what about the first ones? are there any negative consequences of "dropping" elements from the random series generated by the PRNG? – Ezequiel Castaño Jul 16 '20 at 18:00
  • @EzequielCastaño I answered it between the lines: you would be repeating values between chains. – Tim Jul 16 '20 at 18:14
  • 1
    so in case a single seed is set and never re-set or change at the very beginning of an script, there is no reason to worry about correlation? Is there any piece of literature where I can go deeper on the topic that you can recommend? – Ezequiel Castaño Jul 16 '20 at 18:21
  • @EzequielCastaño the point of PRNGs is to generate samples that are undistinguishable from random, if this is what you’re asking. – Tim Jul 16 '20 at 18:23
  • I am asking whether using a single seed for the whole process at the beginning while make two random variables sampled correlated with each other. – Ezequiel Castaño Jul 16 '20 at 18:25
  • @EzequielCastaño not sure what you mean by “whole process”, but in general yes, samples generated by PRNG are as close to random & independent as possible. If you sample from different distributions, then samples from non-uniform distributions would be based on the uniform samples from PRNG, so would be equally random & independent. – Tim Jul 16 '20 at 18:28
  • Tangential comment on generating samples from normal distributions. R does not now use Box-Muller, which can generate standard normal values only between about $\pm 7$ because of overflow and underflow difficulties with the transcendental functions involved. R (and I believe much other statistical software) use Wichura's rational approximation to the standard normal CDF and quantile functions, which are accurate within the span of double-precision arithmetic. – BruceET Jul 16 '20 at 19:58
  • @BruceET that's why I said those are just examples. – Tim Jul 16 '20 at 20:01
0

If you 'set a seed' then it is as if you entered a very long list of pseudo-random numbers at a particular point. Then if you use the same seed again--and generate random variables in exactly the same way--you will get exactly the same results. The following demonstration is from R.

set.seed(716);  x = round(rnorm(5, 100, 15), 2);  x
[1]  86.39 100.10  94.23  58.81 125.45
set.seed(716);  y = round(rnorm(5, 100, 15), 2);  y
[1]  86.39 100.10  94.23  58.81 125.45

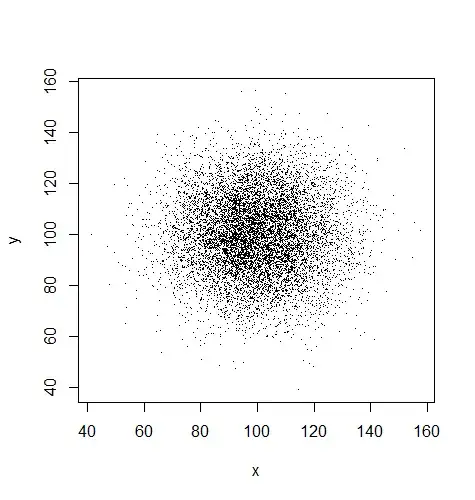
However, if you use a well-vetted pseudo-random generator and you generate two pseudo-random samples sequentially, you will not see any correlation

set.seed(2020)
x = rnorm(10000, 100, 15)
y = rnorm(10000, 100, 15)
cor(x,y)
[1] -0.01272604

plot(x,y, pch=".")

enter image description here

You can read R documentation about the various pseudo-random generators available in R. The default generator is the 'Mersenne-Twister'

BruceET
  • 47,896
  • 2
  • 28
  • 76