I'm playing around with a dataset and would like to run some clustering on it, but I'm hitting some issues regarding scaling, and the result that this has on my principal components analysis (PCA). I am not quite sure what approach to take here. Unfortunately I'm unable to provide example data since it's quite a large dataset, but I don't believe it is necessary as this is more of a conceptual question.
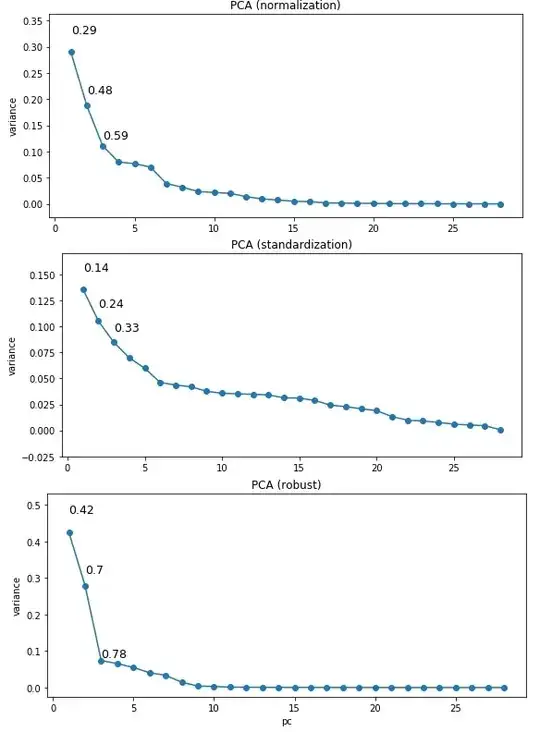
Essentially, I compared the results of standardization, normalization, and robust standardization (like standardization, only using the IQR and the median instead of the STD and mean), all implemented in scikit-learn in Python. I then ran sklearn's PCA on the data, and plotted the variance explained against each PC and got the following outputs (y-axis is variance explained, labels refer to cumulative variance explained):
My data are highly positively skewed for the most part and seem to contain a few outliers, though it's hard to tell given this skew. I'm using on the first few components that explain most of the variance, and eyeballing some of the resulting plots shows that the clustering is quite close to what I want. However, the number of clusters and especially the silhouette scores are quite a bit different, depending on the scaling I'm using.
My questions:
- Given that my data are not gaussian distributed, is it best to use robust scaling over the others?
- Why is the PCA result so different depending on the scaling?
- Is there anything else that I could do instead/additionally to improve this?
I'd appreciate any feedback on this.
