Can one one suggest any suitable plot that shows the observed values, their fitted values and 95% confidence intervals for the fitted values?
Asked
Active
Viewed 1,724 times
2
-
1Almost a dup: https://stats.stackexchange.com/questions/145062/visualising-uncertainty-in-slope-and-offset-for-a-regression-line/432775#432775 – kjetil b halvorsen Nov 01 '19 at 23:24
1 Answers
8
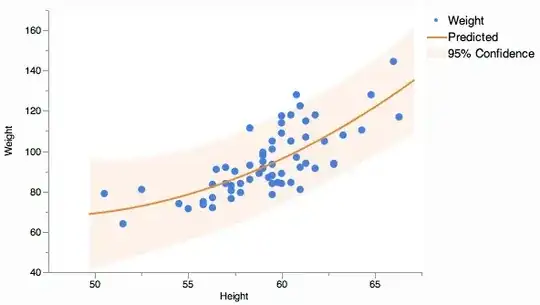
I usually see that information presented by using a curve for the predicted values and a shaded interval for the confidence interval.
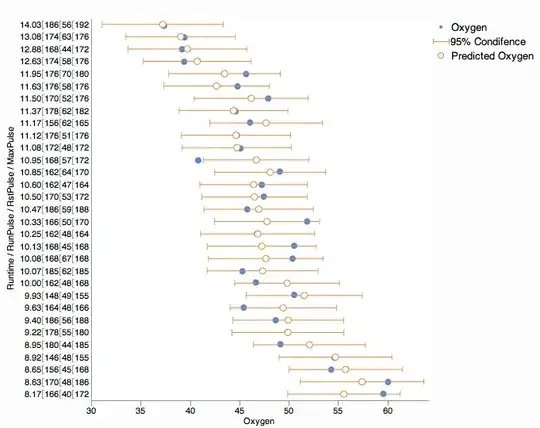
For comparison here is a more literal interpretation of your request, which a individual marker and interval for each factor value.

I'm not aware of a good view of when there are multiple factors. The confidence intervals really belong with the factors and not the response (different factor values could produce the same predicted response value but with different confidence intervals). I suppose you could treat the factors categorically and plot each factor combination separately. Here's a try at that, rotated to make it a little easier to read the four factor values.
xan
- 8,708
- 26
- 39