Please forgive me if this is a stupid question, I am a novice with larger data sets and statistics in general. I have a matrix of data that is 50 x 429 that reflects "signal" obtained from a peptide array experiment - 429 peptides probed with plasma from 50 people. The signal is reflective of how much antibody each person has against that peptide. Unfortunately, out of the 50, only 4 are controls, and 46 are patients - a very unbalanced experiment.
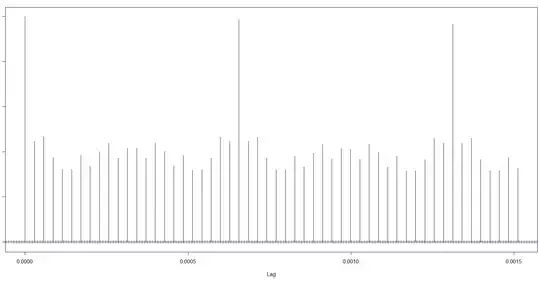
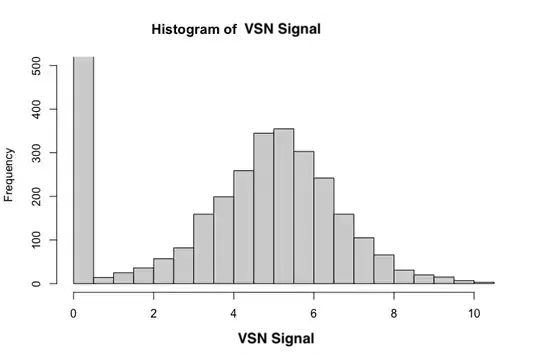
As I understand, we should normalize the data in some manner before trying any comparisons, especially because each array was done separately. The company we worked with provided a dataset that is adjusted using variance stabilizing normalization (VSN) with some modification to the standard method. Below are histograms to show the distribution of the overall data.


In both cases I cut the y-axis off at 500 - the first bin has a frequency of over 19000 in either case. Ignoring the first bin, VSN signal seems to be pretty normal.
Essentially what I'd like to answer is if there are any peptides that have different signal between the 46 patients and 4 healthy controls. I am not sure what test(s) to use. If I can assume normality of my VSN data, despite the huge frequency of the "0.5" bin, a Welch's t test gives me the best result for one peptide that I am confident shows a signal consistently.
If I cannot make the assumption of normality, I presume I would use a Mann-Whitney test to compare these groups. This does not give me any p-values that make sense.
I then adjust the list of 429 p-values I get for false-discovery rate (FDR). The t test still gives me results that make sense, the Mann-Whitney test gets worse.
After this point I'd like to also compare sub-groups, for example comparing patients treated with one drug or the other, or not treated, or healthy. I am comfortable using GraphPad for comparisons like this with simple data - I'd likely end up using a one-way ANOVA with a multiple comparison test. I have tried to replicate this on R, but am unsure if I can use the standard linear model (lm function) followed by an ANOVA (Anova function from the car package) followed by multiple comparisons using the glht function from the multcomp package. Most of my hesitation comes from being unable to determine what assumptions about my data I can carry over to these functions.
Any advice or help would be very much appreciated!