1

I am responsible for a large electricity meter fleet and would like to compare and predict the failures of different types electricity meters from existing data. We have the current number of meters installed and the installation dates. We also have the failure and removal database that includes the installation and removal dates.

The number of meters installed of each type does not remain constant, as can be imagined with more than 20 years of data. When meters fail, they are immediately replaced by either the same or a similar model.

I have found that using quarterly data makes the data more manageable but the raw data remains available for analysis.

From the failure database the number of failures vs. time gives meaningful data until about half the population have failed. How do I normalise this? Do I divide the failures with the number of meters remaining, or do I use another metric?

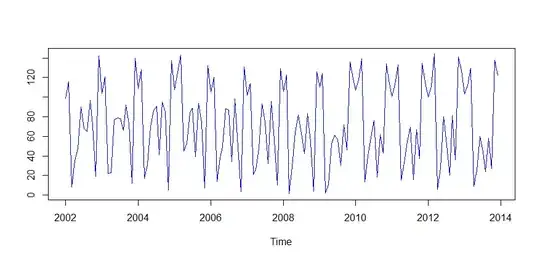
I have also plotted Duane Plots from the detail data, the cumulative failures $F_i = \sum f_i$ divided by $T_i = \sum N_i \cdot t_i$ vs. $T_i$. This provides some meaningful statistics for some types of meters but not for others. I attach a sample graph below.

Is there any other analysis I should use? The focus is to identify the onset of the wear-out for pro-active replacements.

Further, from renewal theory the total replacement cost is the sum of the failure replacement cost $C_f$ and planned block replacement cost $C_p$ as folows:

$$c(t) = \frac{H(t)\cdot C_f+ N\cdot C_p}{t}$$

The minimum is:

$$0 =\frac{dc(t)}{dt}$$

giving

$$t\frac{dH(t)}{dt}-H(t) = N\frac{C_p}{C_f}$$

or

$$t\frac{\Delta H(t)}{\Delta t}-H(t) = N\frac{C_p}{C_f}.$$

I suspect that in my case I also have $N(t)$ and therefore the equation is:

$$t\frac{\Delta H(t)}{\Delta t}-H(t) = \frac{C_p}{C_f}\left(N(t)-t\frac{\Delta N(t)}{\Delta t}\right).$$
enter image description here

skvery
  • 13
  • 6

1 Answers1

1

If you have installation and failure dates for all meters and have replacement dates for meters that were removed before failure, this seems to be a standard application of survival analysis.

For each individual meter you would record the following: time between its installation and its last working presence at the installation, and whether that time of last presence represented a failure event or simply a replacement before failure. In the terminology of survival analysis the latter represents a "censored" observation of lifetime: you don't know how long that the meter would have lasted, just that it certainly lasted as long as it had been present before it was replaced.

I'd recommend that you use the actual date differences, although with 20 years' of data quarterly information might provide adequate granularity. You would also want to include the meter Type, and perhaps the actual date of installation as an additional predictor (though I suspect that date of installation and meter Type will be highly correlated). If there are different types of installation sites or different loads being metered that might affect failure rates, those could be annotated for each meter, too.

There are many ways to set up such analysis, but a parametric survival regression based on the Weibull distribution as a baseline often works for equipment failure analysis. That can provide useful interpretations both in terms of relative hazards of failures and in acceleration of failure times. A parametric regression based on Weibull or some other appropriate baseline distribution can provide a formula for predicted failure rates over time, as functions of the meter Type and other predictors you include in your model. Then you can take those predictions together with your cost estimates to guide your ultimate replacement strategy.

EdM
  • 57,766
  • 7
  • 66
  • 187