2

Assume that I have a line along which I want to randomly place (say) three points. If this were the only requirement, I could simply use independent uniform priors for all three points, and be done with it.

Unfortunately, I have the additional requirement that the points are positioned in a specific order: point one (blue) should always be the leftmost point, point three (green) should always be rightmost point, and point two (red) should always lie somewhere between (see sketch).

Ideally, I would like to position all three points with something close to a uniform prior, but a naive uniform pdf obviously does not fit the bill. I expect that generating random samples, then rejecting all which do not fit the criterion could work, but this seems very inelegant. Is there a more elegant way in which I could formulate a prior which represents this restriction?

enter image description here

J.Galt
  • 409
  • 2
  • 9
  • 3
    What would be the problem with generating a random 3D variable $X=(X_1,X_2,X_3)$ according to any distribution you like, sorting the coordinates, and coloring the smallest blue, the middle red, and the rightmost green? This is not only simple, it's fully general. – whuber Jun 01 '20 at 21:14
  • None immediately, but if I were to employ variational methods (or some other technique which proposes changes to my samples), it could happen that my samples 'switch place', which I would like to avoid. I expect that one could avoid this with some form of sanity check (assigning zero probability density to reordered samples), but an analytic formulation might provide a more elegant solution. – J.Galt Jun 01 '20 at 21:25
  • I don't follow anything after "switch place," because that's not possible with the method I indicated. – whuber Jun 02 '20 at 10:30

3 Answers3

3

Why not generate a sample of three random points from a uniform distribution and then assign them the correct colors according to their order?

Ryan Volpi
  • 1,638
  • 8
  • 17
2

You can also use the stick-braking process. The story is as follows: imagine that we have a stick and we want to break it into $k$ parts. First you break it into two parts, leave one out, and break the latter again into two parts, repeating this $k-1$ times. Since you always break the remainder, the breakpoints would be ordered.

More formally, the algorithm is described by Frigyik et al (2010) in Introduction to the Dirichlet Distribution and Related Processes:

Step 1: Simulate $u_1 \sim \mathcal{B}(\alpha_1, \sum_{i=2}^k \alpha_i)$, and set $q_1=u_1$. This is the first piece of the stick. The remaining piece has length $1-u_1$.
Step 2: For $2 \le j \le k-1$, if $j-1$ pieces, with lengths $u_1,u_2,\dots,u_{j-1}$, have been broken off, the length of the remaining stick is $\prod_{i=1}^{j-1} (1-u_i)$. We simulate $u_j \sim \mathcal{B}(\alpha_j, \sum_{i=j+1}^k \alpha_i)$ and set $q_j = u_j \prod_{i=1}^{j-1} (1-u_i)$. The length of the remaining part of the stick is $\prod_{i=1}^{j-1} (1-u_i) - u_j \prod_{i=1}^{j-1} (1 - u_i) =\prod_{i=1}^j (1-u_i)$.

Step 3: The length of the remaining piece is $q_k$.

This produces a sample from Dirichlet distribution $\mathbf{q} \sim \mathcal{D}(\boldsymbol{\alpha})$. If you want the distribution to be symmetric, you need $\alpha_1=\alpha_2=\dots=\alpha_k$. Notice that $q_i$'s are the lengths of the sticks, so to mark their borders, you need to take cumulated sum.

Example code:

import numpy as np
import scipy.stats as sp
import matplotlib.pyplot as plt

def stick(α):
    k = len(α)
    u = sp.beta(a=[α[i] for i in range(0, k-1)],
                b=[np.sum(α[i:]) for i in range(1, k)]).rvs(size=k-1)
    q = np.zeros(k)
    q[0] = u[0]
    for i in range(1, k-1):
        q[i] = u[i] * np.prod(1 - u[:i])
    q[k-1] = np.prod(1 - u[:k])
    return q

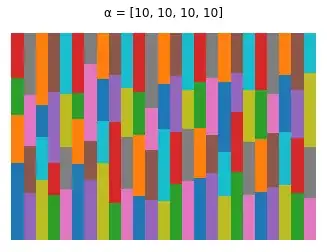
α = [10, 10, 10, 10]
n_sticks = 25

for s in range(n_sticks):
    q = stick(α)
    plt.bar(s, q[0], 1)
    for i in range(1, len(q)):
        plt.bar(s, q[i], 1, bottom=np.sum(q[:i]))

plt.axis('off')
plt.title(f'α = {α}')
plt.show()

enter image description here

You can manipulate the $\alpha_i$ values, for more details see this answer on parameters of Dirichlet distribution.

Of course, if you have more efficient algorithm for drawing samples from Dirichlet distribution, you can use it and just define the breakpoints as $b_j = \sum_{i=1}^j q_i$.

Other solutions are simpler and computationally less demanding, but this is a stochastic process that you might find interesting, since it seems to share some of the properties of your data.

Tim
  • 108,699
  • 20
  • 212
  • 390
  • This sounds interesting, but it seems that if I were to repeat the experiment many times, the points would tend to cluster on one side of the stick (the one which I continue to 'break'). As such, it would not yield a quasi-uniform distribution. Am I misunderstanding this? – J.Galt Jun 01 '20 at 20:12
  • 1
    @J.Galt you can make it uniform when choosing the appropriate parameters, since this produces sample from Dirichlet distribution check https://en.wikipedia.org/wiki/Dirichlet_distribution#Marginal_beta_distributions or http://mayagupta.org/publications/FrigyikKapilaGuptaIntroToDirichlet.pdf for details. – Tim Jun 01 '20 at 21:42
  • @J.Galt my initial description might have been confusing, so I made edits to clarify and give example. – Tim Jun 02 '20 at 08:55
  • Thank you very much for the clarification! This does indeed do exactly what I wanted. I'll have to delve a bit deeper into the theory to form a solid foundation, but your answer provided a fantastic starting point. I'll mark this as the best answer. – J.Galt Jun 02 '20 at 18:17
0

My suggested method of meeting your specifications is shown in R code below.

Are your specifications consistent with three points chosen at random without restriction on $(0,1)?$

set.seed(601)
b = runif(1); b
[1] 0.5592886
g = runif(1, b, 1); g
[1] 0.8007153
r = runif(1, b, g); r
[1] 0.7927287
plot(b, 0, col="blue", xlim=c(0,1), ylim=c(-.1,.1), ylab="")
 points(g, 0, col="darkgreen")
 points(r, 0, col="red")

enter image description here


I think the answer to my question is No. Three unrestricted points according to $\mathsf{Unif}(0,1)$ will have average range $E(\mathrm{Max - Min}) =1/2.$ Three points placed according to your restrictions, if I understand the restrictions correctly, will have average range $E(G - B) = 1/4.$ Here is a simulation. Formal proofs should not be difficult.

set.seed(2020)
rng.u = replicate(10^6, diff(range(runif(3))))
mean(rng.u)
[1] 0.4997172

m = 10^6; rng.bgr = numeric(m)
for(i in 1:m){
 b = runif(1); g = runif(1, b, 1)
 rng.bgr[i] = g-b }
mean(rng.bgr)
[1] 0.2500847
BruceET
  • 47,896
  • 2
  • 28
  • 76