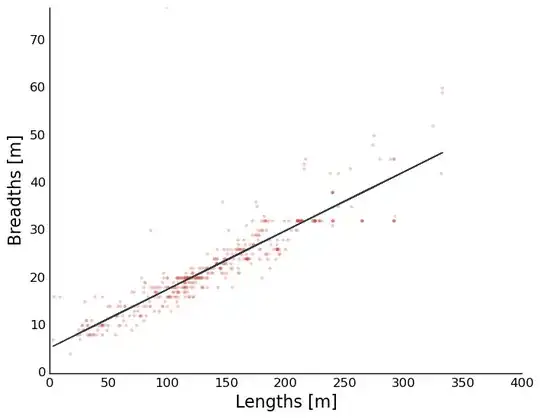
I've got a set of points where 5-20% of the points model almost a perfect linear line (say +- 0.1% of their value), but the other 80-95% of the points are random noise. How can I find a line (slope and y-intercept) that best models the 5-20% signal underneath the noise?
Here's a picture that shows the jist of what I'm talking about:

I'm guaranteed that the true signal is going to have more points lined up in a linear fashion than the random noise might accidentally have.
My initial strategy was to perform a linear regression of the set of points, and then remove the furthest 20% of points from that line, and loop through that 2 step process (linreg, remove) until the standard deviation of distances from the line reached a certain threshold. This worked 70% of the time, but the remaining time the initial line from the linear regression too much modelled the noise and so most of the signal would get removed and the process would fail.
I'm working in python, but I'm really looking for a strategy more than complete code. But if you have some specific code in mind here's the setup:
def find_best_line(x_values, y_values):
    assert len(x_values) == len(y_values)
    # Do Something.

    return slope, y_intercept
I need this solution to scale decently (runtime < 30 mins) with sets as large as 50 million points.
Which is why I have discarded my first idea which was to get a line from every possible pair of points and calculate a metric that was essentially proportional to how many points were very close to that line.
Here is an example dataset the algorithm would need to work on: download dataset