0

Having lost some of my math skills, I am having problems with something that I think should be fairly easy but is eluding me:

I have a plateau shaped function that I would like to standardise such that regardless of the a, b and alpha values and x it always produces a value between 0.2 and 1. It is easy in R to rescale a series of values but not single values.
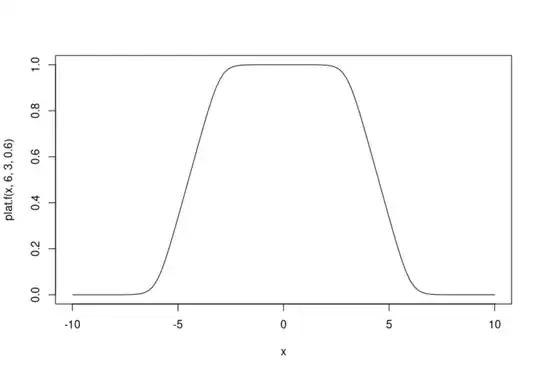
Function in R

plat.f = function(x, a, b, alpha){
  y = log((cosh(2*alpha*pi*a)+cosh(2*alpha*pi* x))/(cosh(2*alpha*pi*b)+cosh(2*alpha*pi*x)))
  y = y/pi/alpha/6
  return(y)
}
curve(plat.f(x, 6, 3, 0.6),-10,10)

[plateau shaped function]

So what I want is that regardless of what values of a, b and alpha I give it will have a value between 0.2 and 1 while right now it is between 0 and a value determined by a and b parameters. So when x=0 I want y=1 and when x=-10 I want y=0.2 and when x=5, y should be somewhere around between 0.33 and 1 while right now it is 0.33.

Edit: Here is some more context and code. If I generate a series from the plateau function with random x between -10 and 10, I will get a series of y values that I can rescale. This rescaled series maintains the meaning of the a and b parameters with the rescaling (vertical lines) while the raw function (black) has a plateau at 1.66 and the rescaled (blue) has the max-min properties I want. I just need to figure out how to do this in the function as I will pull a sample from it with single random x values that I generate and those should follow a function with max, min values and the a and b meaning (in terms of where the plateau falls off and where the ends).

plat.f = function(x, a, b, alpha){
  y = log((cosh(2*alpha*pi*a)+cosh(2*alpha*pi*x))/(cosh(2*alpha*pi*b)+cosh(2*alpha*pi*x)))
  y = y/pi/alpha/6
  return(y)  
}

x=runif(10000,-10,10)
a=9
b=4
alpha=0.4
y=plat.f(x=x, a=a,b=b,alpha=alpha)
plot(x,y,pch=20)
y.rescaled= scales::rescale(y,c(0.2,1))
points(x,y.rescaled,pch=20,col="blue")
abline(v=a)
abline(v=b)

enter image description here

dand
  • 13
  • 4

2 Answers2

1

I guess I needed to think about the generality of your shorten and shift method and of course that is it, I just needed to standardise by the plateau value (when x=0) and then shorten it (multiply) by 0.8 and add 0.2.

plat.f = function(x, a, b, alpha){
  y = log((cosh(2*alpha*pi*a)+cosh(2*alpha*pi*x))/(cosh(2*alpha*pi*b)+cosh(2*alpha*pi*x)))
  y0= log((cosh(2*alpha*pi*a)+cosh(2*alpha*pi*0))/(cosh(2*alpha*pi*b)+cosh(2*alpha*pi*0)))
  y = 0.8*y/y0+.2 #shorten & shift. Thanks BruceET!
  y
}
curve(plat.f(x, 5, 4, 0.6),-10,10)
curve(plat.f(x, 7, 2, 0.6),-10,10, add=T,col="blue")

enter image description here

dand
  • 13
  • 4
0

Here is an illustration in R of a transformation using a uniform distribution that I believe will work for your distribution. The transformation is $U^\prime = .8U + .2.$ (Shorten, then shift.)

u = runif(1000)
u1 = .8*u + .2
summary(u)
    Min.  1st Qu.   Median     Mean  3rd Qu.     Max. 
0.001034 0.265479 0.504193 0.507427 0.755952 0.999773 
summary(u1)
   Min. 1st Qu.  Median    Mean 3rd Qu.    Max. 
0.2008  0.4124  0.6034  0.6059  0.8048  0.9998 
par(mfrow=c(1,2))
  hist(u); hist(u1)
par(mfrow=c(1,1))

enter image description here

The shape of the second histogram looks less 'ragged' because it has only 8 bins, using R's default cut points. That can be controlled.

cutp = seq(0,1,by=.1)
cutp
 [1] 0.0 0.1 0.2 0.3 0.4 0.5 0.6 0.7 0.8 0.9 1.0
par(mfrow=c(1,2))
 hist(u, br = cutp)
 hist(u1, br = .8*cutp+.2)
par(mfrow=c(1,1))

enter image description here

BruceET
  • 47,896
  • 2
  • 28
  • 76
  • Thanks very much, it is an excellent and simple solution. However, I made a mistake in saying that the function always produces values between 0 and 1 in fact it only does for particular a and b values (e.g. a=6, b=3). So shortening and shifting will not work for most parameter combinations. I will edit my question accordingly and add more. – dand May 13 '20 at 18:34