I have a data series that increases exponentially at the beginning and then reaches a plateau, like in a chemical reaction. I would like to find the point where the exponential phase finishes.
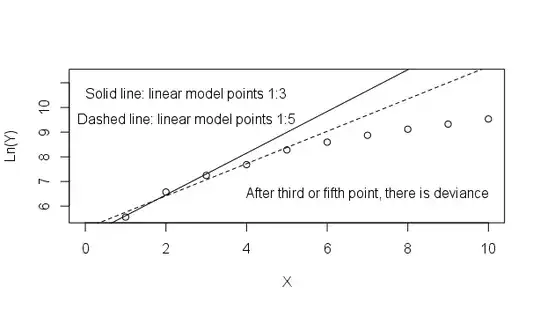
I transformed the data into their natural logarithms in order to obtain a linear series for the exponentially rising data and I am looking for the first outlier of the linear series first outlier that wil pinpoint the end of the exponential phase, as shown in this figure:

I can calculate the residuals of the linear models (here Y is already transformed in ln(Y):
mod_3 = lm(Y[1:3] ~ X[1:3])
res_3 = mod_3$residuals
mod_5 = lm(Y[1:5] ~ X[1:5])
res_5 = mod_5$residuals
mod_6 = lm(Y[1:6] ~ X[1:6])
res_6 = mod_6$residuals
> print(res_3)
          1           2           3
-0.05724195  0.11448390 -0.05724195
> print(res_5)
          1           2           3           4           5
-0.20016682  0.16104238  0.17879988 -0.04005963 -0.09961581
> print(res_6)
          1           2           3           4           5           6
-0.28407154  0.14006620  0.22075225  0.06482127  0.06819364 -0.20976181
>
My question is: how can I test that a given point (let's say point 6 by the look of the data) is significantly deviant from a linear model?
For instance, if I keep the linear model between points 1 and 3, how can I tell if points 4 or 6 are significantly divergent from the estimate? That is: how can I tell if a point is an outlier?
I need to find the minimal number of points that makes a linear series; if I add more and more points, there should be a point where R^2 becomes too big, but the residuals might still be small. For instance, the residual for point 6 is -0.21 in the linear model build on the points 1:6; but
> Y[6]
[1] 8.59471
> mean(Y[1:3])
[1] 6.459196
> Y[6]-mean(Y[1:3])
[1] 2.135513
The problem is how to demonstrate that I should keep the points 1 to 3 as generators of a linear series.
ADDENDUM
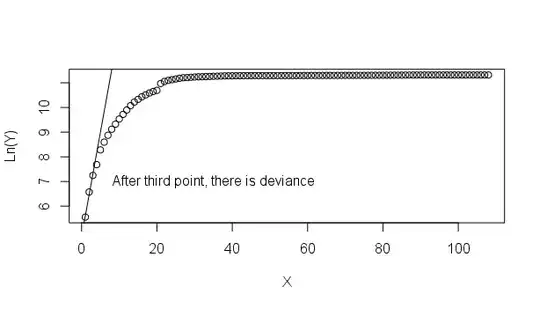
To give a better context, I am adding the whole plotting of the data:

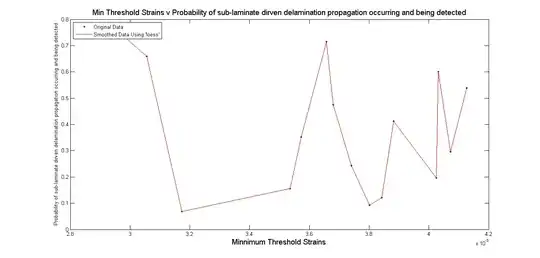
Also, the idea of identifying the first outlier in a linear series is drawn directly from an article written by Tichopad et al. (Nucleic Acids Research, Volume 31, Issue 20, 15 October 2003, Page e122). In this paper, the values are those of the fluorescence in a polymerase chain reaction, which pass from linear to exponential to plateau as in this figure:

But instead of looking at the change in the cycles 1-16, I am looking for that in the cycles 20-30. To find the first outlier, a series of statistical parameters were calculated, which included an ‘externally studentized’ residual, the mean square residual of the regression model with the deleted inspected data point, the distribution of the studentized residuals, and the cumulative function of the studentized residuals. The probability that spots an outlier is given by P‐value = 2 × [1 – F(1 – |r(n – 1)|)], with F the cumulative function, r the ‘externally studentized’ residual and n the point in evaluation.