1

I have two data sets, A and B, and I have linked them together using automatic, probabilistic methods to create a set of linked records (L). For example, my code could have predicted that record 1 in set A most likely refers to the same item as record 3 in set B. I then took a small sample from set A and found the correct record from B for each of these items. I’ll call this set of checked linked records the gold standard (G). I can then use G to check L.

Using true positives (TP), the number of times that G is the same as L, and false positives (FP), the number of times that G is not the same as L, the positive predictive value (PPV), TP/(TP+FP), measures the proportion of classified matches that are correctly identified as such. In the record linkage and classification literature It is referred to as precision but it is not analogous to the closeness of a set of measurements to each other and so to avoid confusion I will refer to it as PPV. Where a representative sample of a population is tested, PPV is a prediction of the positive post-test probability; the probability of the presence of a condition after a positive diagnostic test, or in record linkage, the probability that each pair of linked records (POLR) is correct.

I can predict confidence intervals and the distribution of PPV with a bootstrap; that is by sampling from G with replacement. But consider the case where I get a PPV of 1. That would indicate that each POLR in G is predicted correctly in L. But while I am happy to assume that G is perfectly correct, I don’t want to assume that it is perfectly representative of L, which is a vastly larger set. How can I adjust my bootstrap to take account of the possibility (it is highly likely) that my sample is not perfectly representative of the total population please?
R. Cox
  • 179
  • 7
  • A coleague advised "Perhaps you might look into some Bayesian methods so you can express prior information to account for the lack of information that you can deduce from your data. This is particularly useful for small sample sizes, and in cases where you can provide meaningful prior distributions on your random variables. I'm not sure if that's the case for you, but if it is, it could be worth a look... – R. Cox May 28 '20 at 13:29
  • "... It might help to clarify for yourself what statistical model you are using (i.e. what are the random variables, what distributions are you assuming, what independence/dependence assumptions you are making, etc.)" – R. Cox May 28 '20 at 13:29
  • Maybe a duplicate of this https://stats.stackexchange.com/questions/82720/confidence-interval-around-binomial-estimate-of-0-or-1 – R. Cox May 31 '20 at 13:16
  • PPV is a point estimate of the prevelance of true matches in L – R. Cox Oct 22 '20 at 11:57

2 Answers2

0

One wrong answer:

Is it ok if I rephrase the question please, using a different example? Consider my ten thousand friends. They each toss a coin. It's the same coin. I know nothing aboout coins. So I ask one of them, Archer. He got heads. Is it the same question to ask: 'what is the probability distribution of what everyone got?'

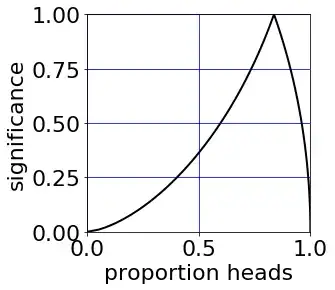
I tried a Jeffreys prior and a full range of lower and upper confidence intervals which gave me this: enter image description here

So the significance that nobody, not even Archer, got heads is 0. Fair enough, I believe him. But the significance that everybody, even Archer, got heads is also 0. This needs adjustment.

And one potential answer:

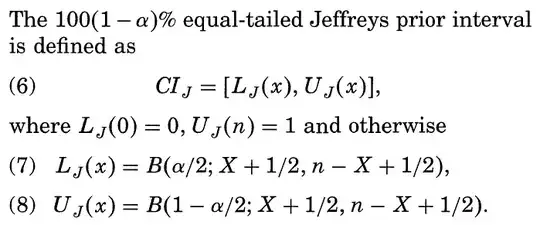
Brown, L.D., Cai, T.T. and DasGupta, A., 2001. Interval estimation for a binomial proportion. Statistical science, pp.101-117. Give these adjustments:

enter image description here

Where 'B' is a Beta distribution. It gives these confidence intervals for the proportion of heads with one sample and one positive result:

enter image description here

for example, a 95% confidence interval (CI) has a significance of 0.05 and this function gives the 95% CI of the proportion of heads with one sample and one positive result as [0.147, 1].

R. Cox
  • 179
  • 7
  • Python code here: https://stackoverflow.com/questions/62064755/if-statement-to-override-value – R. Cox May 28 '20 at 12:30
0

As long as your records are not correlated, there is a much simpler approach: any technique for a single proportion will work. Asymptotic methods will not work well, because they assume at least a decent number of 1s and 0s, but you have all 1s. However, there are alternatives. Let's use the example of 100 out of 100 correctly classified records, and here's some methods with R code and resulting 95% confidence (or credible) intervals:

  • exact methods such as the Clopper-Pearson confidence interval qbeta(0.025, 100, 0+1) = 0.964 to qbeta(0.025, 100+1, 0) = 1, or
  • Jeffreys with a Beta(0.5, 0.5) prior: qbeta(c(0.025, 0.975), 100+0.5, 0.5) = 0.975 to 0.999995.

Why do you need to worry about correlated records and when would this happen? This could e.g. happen if you asked 10 different people to try to deal with the same 100 records, when obviously the same record classified by 10 different people does not provide the same information as if they had each looked at completely independent records. In that case, techniques for independent trials for a single proportion will not work, but e.g. methods like logistic regression with a random record and a random person effect could work (but you'd probably have to take a Bayesian approach to deal with the perfect separation of the observed proportion being 1).

Björn
  • 21,227
  • 2
  • 26
  • 65
  • Thanks @Björn. If you read my answer to this question, I show that the Jeffreys method needs adjustment, as in Brown. Brown also shows that Clopper-Pearson over covers. – R. Cox Jun 21 '21 at 11:22