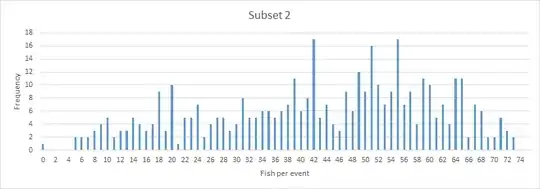
I have a dataset consisting of observations of number of fish caught per sampling event and would like to conduct a variety GLM analyses on it using R. The maximum number of fish is capped at 75 (total number of hooks set out), but can range anywhere from 0 to 75. I need to make comparisons across all sorts of subsets of the data, and the distribution of observations differs widely across these subsets. See below for charts showing the distribution of all observations and 3 possible subsets.
Due to the number of models I plan to test (hundreds), checking the fit for each model permutation before analysis is not a feasible option. I have ruled out Poisson as the mean and variance are not similar. I'm leaning toward negative binomial, but am also doing some research on hermite and tweedie distributions as possibilities to deal with this dataset which is loaded with caveats and may be different depending on the subset, e.g., count data; observations truncated at 0 and 75; often multimodal; sometimes zero-inflated; differing potential size of subsets for comparison; etc.


