2

I come accross the relaimpo package in R with the hope of using it to assess the importance of the regressors in a linear regression problem. I am interested in understanding how to relate the output of the relaimpo, e.g. lmg method to the coeficients of the models displayed as summary(model). I was reading the info in the package relaimpo and also followed this link Importance of predictors in multiple regression: Partial $R^2$ vs. standardized coefficients.

In the package for instance, there is an example where only numerical regressors are used: enter image description here
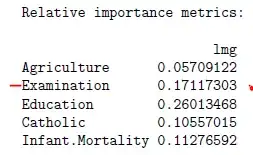
One can see that the regressor Examination is negative and not significant. The author runs relaimpo with lmg and the output is below:

I thought the output of relaimpo is used to rank the regressor importance to the output, namelly: Education (1), Examination(2), InfantMortality (3), Catholic(4), Agriculture (5). Not sure I get it right because here Examination seems to have an important role (second). I know the output is only positive as they will explain the variance.

enter image description here

My questions:

  • What are the most influential regressors in this case?
  • Could one say that the Examination regressor has indeed an important impact and it is NEGATIVE?
  • supposing I use also categorical regressors, and I got a rank from relaimpo. does this mean that each level is important?
  • Should I use the ranking from relaimpo as a global assesment and then compute the effect (how?) for those regressors which come at teh first place (supposing I have more than 40 and I'm interested only on the first top ten)

Thank you
gogo88
  • 21
  • 3
  • As its acronym suggests. Relaimpo evaluates *relative variable importance*. Unless it's run on standardized (mu=0, sd=1) data, a regression coefficient does not contain comparable information since it is expressed in the units of the underlying variable, i.e., it is not scale invariant. –  Apr 30 '20 at 15:58
  • My questions was mainly on how to interpret its output when we talk about categorical variables as they have different levels. For instance, if a variable has three levels:low, mid and high and the output of relaimpo rank this as top 3 among the others I would like to know how to interpret eache level and to quantify it's effect on the output var. Using the standardised coeficients as effect measure seems to be unreliable in case of multicolinearity (which is my case) and several approaches are recommended (consider structur coefficients, commonality analysis , conditional inference tree) – gogo88 May 11 '20 at 11:27
  • I'm not aware that Groemping specifically addresses your question about multilevel categorical features. You might reach out to her directly about that. One heuristic would be to run the model without an intercept and examine the resulting t-values for each parameter in the model, including the levels of categorical features. t-values are standardized metrics and therefore are informative wrt relative importance. –  May 12 '20 at 15:40
  • did you get your answers? I am facing the same questions – DanielG Apr 28 '21 at 12:30
  • no, I didn't get any answer so far. – gogo88 Apr 29 '21 at 13:30

0 Answers0