We have some very nice discussions about SIR model fitting at CV. As I explore the model with different parameters, I have some questions on the definitions of susceptible and recovered population. And how to align the mode with real world scenario.
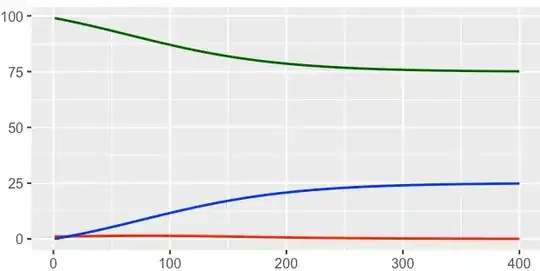
Specifically, we always see some plot like this, where green, red, and blue represent S,I,R respectively.
My biggest confusion is that, In real world, the green curve and the blue curve should far away from each other, i.e, most diseases will never infect everyone in all population eventually.
Therefore I changed some parameters to make some thing like this happen.
Then, I think it is not realistic because $R0$ is almost equal to $1.0$.
Here is my question: let's use covid19 as example, we know this virus will not affect everyone in a given country (we draw this conclusion from the observation from ourself, we know most of our friends and families are not infected, well hopefully). And the $R0$ of covid19 is not close to $1.0$.
Then there are conflicts here, and how can we fix it?

