0

Statistics is new to me. My dataset has 7000 incidents that were processed within x number of days. I took a sample of 400 from the population:

ID      closedindays"
"1"     2
"2"     27
"3"     64
"4"     2
"5"     16
"6"     5
"7"     4
"8"     7
"9"     4
"10"    1
"11"    35
"12"    1
"13"    2
"14"    1
"15"    33
"16"    22
"17"    6
"18"    6
"19"    27
"20"    1
"21"    0
"22"    2
"23"    0
"24"    16
"25"    1
"26"    10
"27"    1
"28"    2
"29"    16
"30"    0
"31"    4
"32"    9
"33"    0
"34"    16
"35"    66
"36"    1
"37"    0
"38"    11
"39"    9
"40"    25
"41"    5
"42"    7
"43"    70
"44"    0
"45"    7
"46"    67
"47"    10
"48"    74
"49"    0
"50"    1
"51"    7
"52"    17
"53"    14
"54"    6
"55"    6
"56"    11
"57"    2
"58"    14
"59"    4
"60"    14
"61"    2
"62"    97
"63"    0
"64"    17
"65"    3
"66"    4
"67"    3
"68"    2
"69"    0
"70"    6
"71"    7
"72"    3
"73"    8
"74"    58
"75"    13
"76"    53
"77"    3
"78"    0
"79"    1
"80"    9
"81"    1
"82"    1
"83"    0
"84"    45
"85"    1
"86"    14
"87"    4
"88"    4
"89"    6
"90"    1
"91"    0
"92"    0
"93"    3
"94"    1
"95"    0
"96"    7
"97"    1
"98"    4
"99"    5
"100"   4
"101"   13
"102"   1
"103"   66
"104"   0
"105"   3
"106"   0
"107"   50
"108"   13
"109"   36
"110"   2
"111"   3
"112"   0
"113"   50
"114"   35
"115"   57
"116"   0
"117"   4
"118"   1
"119"   1
"120"   3
"121"   0
"122"   4
"123"   20
"124"   16
"125"   53
"126"   4
"127"   9
"128"   4
"129"   50
"130"   51
"131"   0
"132"   6
"133"   3
"134"   58
"135"   3
"136"   1
"137"   1
"138"   4
"139"   66
"140"   0
"141"   4
"142"   1
"143"   1
"144"   16
"145"   11
"146"   1
"147"   9
"148"   12
"149"   0
"150"   1
"151"   7
"152"   1
"153"   17
"154"   2
"155"   1
"156"   12
"157"   0
"158"   5
"159"   6
"160"   13
"161"   9
"162"   5
"163"   12
"164"   2
"165"   0
"166"   1
"167"   0
"168"   1
"169"   3
"170"   1
"171"   1
"172"   0
"173"   16
"174"   9
"175"   16
"176"   1
"177"   3
"178"   1
"179"   2
"180"   4
"181"   5
"182"   55
"183"   14
"184"   49
"185"   2
"186"   63
"187"   0
"188"   5
"189"   3
"190"   51
"191"   50
"192"   11
"193"   1
"194"   17
"195"   65
"196"   26
"197"   26
"198"   1
"199"   6
"200"   0
"201"   3
"202"   8
"203"   2
"204"   18
"205"   0
"206"   2
"207"   1
"208"   0
"209"   0
"210"   1
"211"   53
"212"   10
"213"   2
"214"   11
"215"   0
"216"   8
"217"   2
"218"   0
"219"   11
"220"   1
"221"   1
"222"   5
"223"   0
"224"   6
"225"   3
"226"   1
"227"   17
"228"   2
"229"   1
"230"   36
"231"   50
"232"   1
"233"   2
"234"   1
"235"   31
"236"   3
"237"   31
"238"   1
"239"   0
"240"   70
"241"   13
"242"   1
"243"   6
"244"   0
"245"   8
"246"   0
"247"   0
"248"   5
"249"   5
"250"   66
"251"   1
"252"   12
"253"   5
"254"   17
"255"   1
"256"   0
"257"   9
"258"   2
"259"   5
"260"   1
"261"   1
"262"   0
"263"   5
"264"   15
"265"   0
"266"   0
"267"   3
"268"   13
"269"   0
"270"   1
"271"   1
"272"   48
"273"   46
"274"   1
"275"   1
"276"   11
"277"   59
"278"   0
"279"   0
"280"   50
"281"   6
"282"   1
"283"   0
"284"   1
"285"   3
"286"   0
"287"   34
"288"   50
"289"   70
"290"   116
"291"   15
"292"   31
"293"   153
"294"   3
"295"   1
"296"   7
"297"   6
"298"   9
"299"   6
"300"   4
"301"   13
"302"   8
"303"   1
"304"   4
"305"   7
"306"   11
"307"   14
"308"   8
"309"   1
"310"   12
"311"   7
"312"   0
"313"   1
"314"   66
"315"   52
"316"   21
"317"   1
"318"   2
"319"   5
"320"   26
"321"   1
"322"   2
"323"   30
"324"   18
"325"   9
"326"   26
"327"   10
"328"   24
"329"   0
"330"   0
"331"   1
"332"   1
"333"   0
"334"   0
"335"   1
"336"   7
"337"   2
"338"   20
"339"   5
"340"   6
"341"   1
"342"   13
"343"   23
"344"   5
"345"   69
"346"   1
"347"   8
"348"   1
"349"   3
"350"   1
"351"   35
"352"   1
"353"   10
"354"   17
"355"   64
"356"   6
"357"   7
"358"   41
"359"   0
"360"   26
"361"   1
"362"   9
"363"   35
"364"   1
"365"   5
"366"   7
"367"   65
"368"   4
"369"   2
"370"   0
"371"   62
"372"   5
"373"   7
"374"   1
"375"   4
"376"   3
"377"   0
"378"   70
"379"   25
"380"   5
"381"   1
"382"   5
"383"   10
"384"   2
"385"   51
"386"   0
"387"   1
"388"   4
"389"   72
"390"   73
"391"   8
"392"   3
"393"   2
"394"   70
"395"   10
"396"   3
"397"   2
"398"   2
"399"   26
"400"   56

The population and sample seems to have a right-skewed distribution.

What is my hypothesis?

My hypothesis is that tickets are processed within 14 days on average. I made the following hypothesis:

H0: <= 14
H1: > 14

What is the problem?

The problem is that my data is not normally distributed. Because of this I don't think i can do the one tailed Student's t-test.

The Wilcoxon signed rank test seems to be a option. But this one checks on the median.

How can i test my hypothesis on the mean?
  • With $n \approx 7000$ and only a couple of outliers beyond 70 (if I scanned your data accurately) you might be able to use a one-sample t test. // Or you might use a bootstrap procedure as [here](https://stats.stackexchange.com/questions/92542/how-to-perform-a-bootstrap-test-to-compare-the-means-of-two-samples/92553#92553). – BruceET Apr 27 '20 at 09:14
  • 1
    You have some zeros there, presumably if daily date notified == daily date closed. You could defensibly consider working with log(days + 1) or log(days + 0.5) as a check on working with data as they arrive. – Nick Cox Apr 27 '20 at 10:15

1 Answers1

1

Robustness of t Tests for Huge Badly-Skewed Samples

Failing to reject when null hypothesis is true. I won't use your data, leaving that for you to explore. However, consider a sample of size $n = 7000$ simulated using R from a (highly skewed) exponential population with $\mu=14.$

set.seed(2020)
x = rexp(7000, 1/14)
summary(x)
     Min.   1st Qu.    Median      Mean   3rd Qu.      Max. 
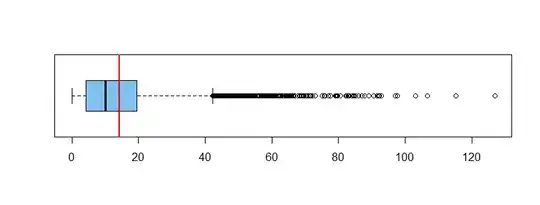
  0.00208   4.19694  10.06145  14.25631  19.42518 126.88984 

boxplot(x, horizontal=T, col="skyblue2")
  abline(v=mean(x), col="red", lwd=2)

enter image description here

Now I do a t test of $H_0: \mu = 14$ against $H_a: \mu \ne 14.$ Does the t test fail to reject, which would be the correct result?

t.test(x, mu=14)

        One Sample t-test

data:  x
t = 1.5181, df = 6999, p-value = 0.129
alternative hypothesis: true mean is not equal to 14
95 percent confidence interval:
  13.92534 14.58729
sample estimates:
mean of x 
 14.25631 

Fails to reject and the confidence interval includes $14.$

Rejecting when null hypothesis is false. Now consider a sample of the same size from an exponential population with $\mu = 14.5.$ Again testing $H_0: \mu = 14$ against $H_a: \mu \ne 14,$ one would hope to reject $H_0.$

set.seed(428)
y = rexp(7000, 1/14.5)
summary(y)
     Min.   1st Qu.    Median      Mean   3rd Qu.      Max. 
  0.00473   4.26687  10.00742  14.45444  19.99045 139.90676

t.test(y, mu=14)$p.val
[1] 0.008786323

Rejects $H_0$ with P-value $0.0088 < .05.$

Summary. My simulated exponential samples may not be as unruly as your real data. And two tests doesn't provide a lot of evidence. However, experience has shown that t tests perform well even with skewed data when sample sizes are very large.

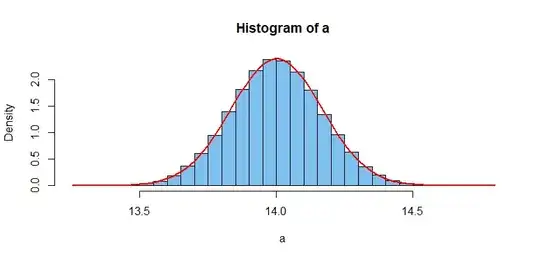
Means of huge exponential samples are nearly normal With an exponential distribution I can show you that a sample mean of $n=7000$ observations is nearly normally distributed. Here is a simulation to show this using 100,000 averages. (The theory isn't difficult because then average of 7000 exponential random variables is a gamma random variable with shape parameter 7000, which is very nearly normal---according to the Central Limit Theorem.)

a = replicate(10^5, mean(rexp(7000, 1/14)))
hist(a, br=40, prob=T, col="skyblue2")
 curve(dnorm(x, mean(a), sd(a)), add=T, col="red", lwd=2)

The red curve through the histogram of sample means is the best-fitting normal distribution. Clearly averages of 7000 exponential observations are nearly normal.

enter image description here

BruceET
  • 47,896
  • 2
  • 28
  • 76