I am working on research that involves frequency of events (summed during an hour) and duration of events (calculated a seconds during an hour). Both data types have 0s and are positively skewed. The observations (n = 14,000+) are collected hourly for up to 2 weeks for 500 participants. A simple version of the model is: outcome ~ explanatory + (1|participant/date).
For the frequency data, I have fit:
- (Hurdle) Negative Binomial (the var > mean)
- (Hurdle) Gamma (log link) (assuming okay to treat frequency data as continuous)
For the duration data, I have fit:
- (Hurdle) Gamma (log link)
- Zero-Inflated Beta (after transforming duration by SECONDS/3600. I decided to try Beta because the hourly data is bounded at 3600 seconds).
N.B. If fitting regular gamma/beta, I first transformed data to remove 0s. For both the regular and zero-inflated beta, I also shrunk the 1s using EITHER the algorithm here: https://www.ncbi.nlm.nih.gov/pubmed/16594767 OR the inverse hyperbolic sine transformation (IHST)). I had thought about using ZOIB, but I did not want to use BRMS or GAMLSS (since I am a beginner).
I am also considering fitting a Tweedie distribution to both the frequency and duration data. (On a side note - does one transform Tweedie beta coefficients for interpretation - e.g., exponentiate and discuss as rates?).
I had thought about comparing AIC, R2, etc to the above, but understand this is suspect. Therefore, I thought about using cross fold validation. However, the package I was recommended to use (cvms https://github.com/LudvigOlsen/cvms) says it supports lmer/glmer, but doesn't appear to support glmmTMB, which is how I fit the above models.
I thought a potential solution might be to fit two separates models (binomial for 0/1 data and count/continuous for positive data, as suggested in this post: assessing glmmTMB hurdle model fit using DHARMa scaled residual plot). In this way, I could fit lmer/glmer, and perform cross fold validation using cvms on the positive data. But I'm not sure if this makes sense (to partition out the 0 data, and only use the positive data to validate the models)? I suppose I could create my own folds and simulate my own data to check predictive accuracy on the glmmTMB models?
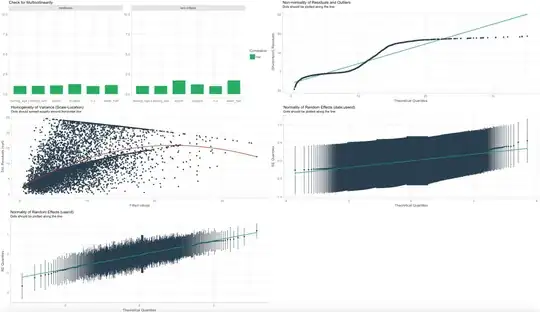
Finally, I have used the performance package to check the model assumptions. The below are results for Hurdle Gamma on Duration (pic 1 and 2 have different explanatory variables), and are pretty similar to the results for the other models. Given the size of my sample and the distributions, how concerned should I be about the QQ plots and homogeneity of variance plots? We are not concerned with predicting new data, but explaining the data that we have.

