2

I have following data from product reviews that were recoreded yearly. The higher the score, the better it is.

year             2000, 2001, 2002, 2003, 2004, 2005, 2006, 2007, 2008, 2009
score           35.3, 39,1, 66.3, 75.9, 72.8, 33.3,  88.2, 78.1, 11.2, 82.8

Now I want to get overall score to understand how good this product was over the years.

When I use mean it gives equal weight to all the years. However, I want to get the overall score by weighting more on the recent years. Therefore, I used the following equation.

overall_score = (0.1(score_of_2000) + 0.2(score_of_2001) + 0.3(score_of_2002) + 0.4(score_of_2003) + 0.5(score_of_2004) + 0.6(score_of_2005) + 0.7(score_of_2006) + 0.8(score_of_2007) + 0.9(score_of_2008) + 1.0(score_of_2009) + 0.1(score_of_2010)) /10

However, this is like linearly weighting the years. Is there a better way of favouring more recent years?

I am happy to provide more details if needed.
EmJ
  • 592
  • 3
  • 15
  • 2
    Exponential smoothing is one approach to *weighting* time series information by recency. This is accomplished by adjusting the smoothing parameter, e.g., see https://en.wikipedia.org/wiki/Exponential_smoothing – Mike Hunter Apr 18 '20 at 18:21
  • @MikeHunter Thank you. I think using exponential smoothing is a great suggestion. What is your recommendation of getting the `overall_score` using the smoothed line. Is it something like `mean`? I look forward to hearing from you. Thank you very much :) – EmJ Apr 19 '20 at 01:05
  • 1
    Yes, exponential smoothing will give you a weighted mean for the overall score as a function of the smoothing parameter that you choose. – Mike Hunter Apr 19 '20 at 14:01

1 Answers1

1

The preferred method is to allow the data to speak for itself ..it is called arima modelling which is in effect a simple weighted average of the past allowing for possible anomalies.

You have a time series problem requiring a time series solution. The preferred method is an optimized weighted average of the past ... this method is called ARIMA or univariate Box-Jenkins. Concern has to be given to identifying and adjusting for unusual observations/pulses or level shifts or local time trends.

Your suggested model is a particular case.

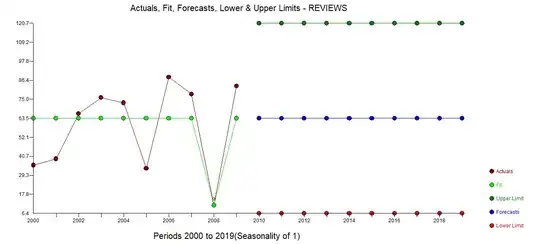
I took your 10 values and introduced them to a software package that I have helped to develop to help guide users to the selection of a useful scheme to weight the past which evaluates minimally sufficient alternatives. In this case there is no temporal decaying or temporal anything and selects an equally weighted average of the 10 values while adjusting (accomodating) for 1 anomalous value at time period 9.

Here is the Actual/Fit and Forecast graph is here enter image description here

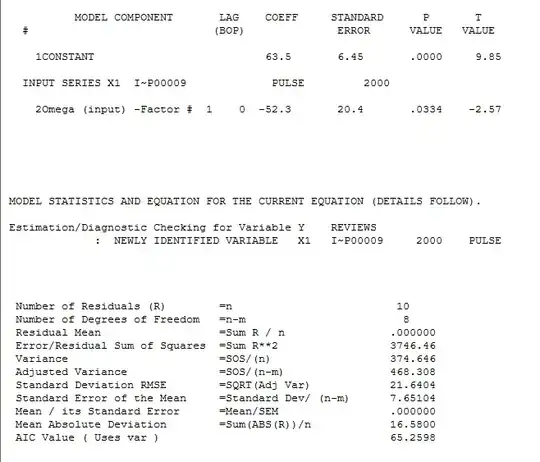
The cleansed graph illustrates the identified anomaly at period 9 enter image description here and here enter image description here . Note the suggested replacement for the errant/questionable value (11.20) at period 9 viz 63.53 which (in this case) is the EQUALLY WEIGHTED average of the other 9 values.

The model is here enter image description here

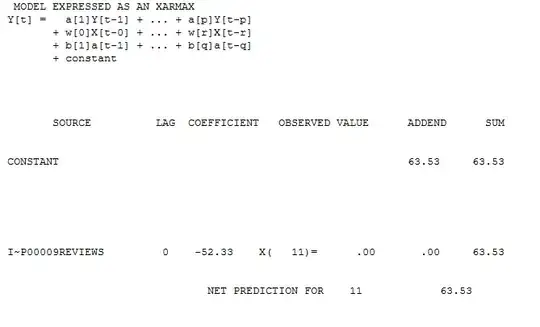
A unique output is the presentation of the model in simple terms enter image description here

For more please see my response to Seasonal ARIMA model mathematical equation

An ARIMA model is simply a weighted average. It answers the double question;

1) How many period (k )should I use to compute a weighted average and 2) Precisely what are the k weights

It answers the question of how to determine how to respond/adjust to previous values ( and previous values ALONE ) in order to project the series ( which is really being caused by unspecified causal variables ) . Thus an ARIMA model is a poor man's causal model .

Essentially 63.5 is the ROBUST MEAN .

IrishStat
  • 27,906
  • 5
  • 29
  • 55