"I refer to outliers identified by the boxplot"
You can miss many outliers proceeding this way:
an observation can be outlying in the multivariate
(design,dependant)-space without being obviously outlying in
any of the (design/dependant) variable taken in isolation.
The best procedure is simply to use an estimation
method that is not affected by outliers. Robust
anova/regression routines are implemented in most
common statistical software. As an example in R
in the package robustbase.
Below I illustrate how multivariate outliers
can wreck a linear model without standing
out in any of the (design/dependant) variable
individually.
library(robustbase)
data(salinity)
library(MASS)

Xa<-mvrnorm(5,colMeans(salinity[,paste0("X",1:3)]),cov(salinity[,paste0("X",1:3)]))
Ya<-Xa%*%c(-2,0,2)+rnorm(5,0,1/5)-20
salinity2<-as.data.frame(cbind(c(salinity$X1,Xa[,1]),c(salinity$X2,Xa[,2]),c(salinity$X3,Xa[,3]),c(salinity$Y,Ya)))
colnames(salinity2)<-colnames(salinity)
By construction, these 5 outliers will not visible on the variable-wise boxplots.
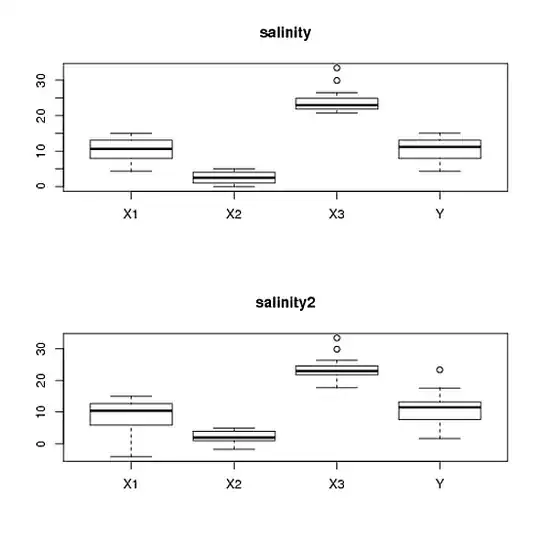
Yet, if you run an ANOVA on salinity2 you will get completely different results
as an ANOVA ran on salinity. The robust ANOVA on the other hand gives essentially the same results for salinity2 as for salinity:
m0r.sali<-lmrob(Y~.,data=salinity)
m0c.sali<-lm(Y~.,data=salinity)

m1r.sali<-lmrob(Y~.,data=salinity2)
m1c.sali<-lm(Y~.,data=salinity2)

summary(m1r.sali)$coef
summary(m0r.sali)$coef

summary(m1c.sali)$coef
summary(m0c.sali)$coef
Here is a good recent review article on robust statistics.