I have a $10,000$ observations (say vector $x$) which I think follows some distribution function $F$. Now, to check this I want to apply Goodness of Fit test. My question is, Is applying goodness of fit directly on this set of observation (test for $F$) same as applying goodness of fit on $y$ checking for $Unif(0,1)$ where $y_i=F(x_i)$?
If not, Under what conditions will it fail?
I know $F(x)$ follows uniform and $F^{-1}(y)$ follows $F$(if the Hypothesis is true that is)
But if the Hypothesis is false, is it possible that the second test passes where the first failed?
- 107
- 5
-
I know this might be a stupid question but does the following statement solve the question? $x$ follows $F$ iff $F(x)$ follows Uniform$(0,1)$. I have my doubts because we're sampling and not considering the population – Anvit Mar 20 '20 at 17:00
-
1You make some strong implicit assumptions about $F$--and perhaps that's what this question is asking about. It is not the case that $y$ will have a uniform distribution unless $F$ is continuous. – whuber Mar 20 '20 at 17:04
-
1@whuber I'm dealing with Gamma so I don't think that'll be an Issue. But I wanted to know if it wouldn't work somewhere so this is good to know as well. – Anvit Mar 20 '20 at 17:19
-
1Okay, good. The answer to your question depends on what goodness of fit test you are performing. Could you explain? – whuber Mar 20 '20 at 17:49
-
@whuber I didn't know there were multiple Chi Sq tests! I'm using the standard R implementation which I hope is Pearson's Chi Sq Test as shown on the Wikipedia page for "Goodness of fit". So basically I still haven't explicitly done the first test I described above on R. I did the second one only which I did by converting it to 20 equi sized bins – Anvit Mar 20 '20 at 18:18
-
2Not only are there many chi-squared tests, there is a huge number of goodness-of-fit tests that don't use a chi-squared approach at all. The conditions needed for a chi-squared GoF test to succeed are described in my post at https://stats.stackexchange.com/a/17148/919. If you have followed them all, then the answer to your main question should be evident, because the test ultimately depends only on the bin counts and they don't change when you pass from the $y_i$ to the $x_i$ (at least they shouldn't!). – whuber Mar 20 '20 at 18:46
-
@whuber I think I get it. Can you elaborate the second point "You must base that estimate on the counts, not on the actual data!"? I don't exactly see the problem in the example. Also, for the first point (example), are you not using the MLE for $\Sigma$? Please Add it as an answer if thats fine – Anvit Mar 20 '20 at 19:21
-
2There's a difference between the MLE based on the data and the MLE based on the counts. You have to estimate the parameters using the counts. This difference probably is inconsequential with medium to large datasets. – whuber Mar 20 '20 at 19:30
1 Answers
Suppose I have 10,000 observations precisely from $\mathsf{Gamma}(shape=5, rate=0.1).$ Generate them in R as follows:
set.seed(2020); x = rgamma(10^4, 5, .1)
(1) Then, because we know the distribution and its parameters, a basic Kolmogorov-Smirnov test in R, finds that my observations are consistent with $\mathsf{Gamma}(shape=5, rate=0.1).$
ks.test(x, pgamma, 5, .1)

        One-sample Kolmogorov-Smirnov test

data:  x
D = 0.0096536, p-value = 0.309      # Not rejected at 5%
alternative hypothesis: two-sided
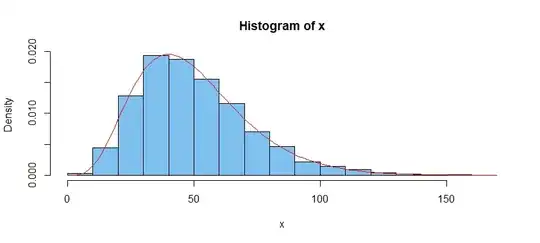
Here is a histogram of the large sample, along with the density function of $\mathsf{Gamma}(shape=5, rate=0.1).$
hist(x, prob=T, col="skyblue2")
curve(dgamma(x, 5, .1), add=T, col="red")  # dummy argument 'x' req'd
(2) You might take the apparent good fit of the histogram to the intended density function as an informal (non-quantitative) visual goodness-of-fit test.
(3) You are correct that transforming by the CDF gives a standard uniform distribution. (In fact, the K-S test uses this transformation as its first step, essentially looking at the largest deviation of the empirical CDF of the transformed data from the exact CDF of standard uniform, and using a distribution based on the Brownian Bridge.)
hist(pgamma(x, 5, .1), prob=T, col="skyblue2")
curve(dunif(x, 0, 1), add=T, col="red", n=5000)  # 'n=5000' for good plot
Then you could count the number of observations in each of the 20 histogram bars $(Y_1, \dots, Y_{20})$ and do a straightforward chi-squared test using the statistic $$Q = \sum_{i=1}^{20} (Y_i - E_i)^2/E_i,$$ where all $E_i = 10,000/20 = 500.$ Under the null hypothesis that data follow the intended gamma distribution, $Q \sim \mathsf{Chisq}(df=19).$
In R, you could fetch the 20 counts $Y_i$ as follows:
hist(pgamma(x, 5, .1), plot=F)$counts
 [1] 459 471 488 534 493 544 511 521 502 528
[11] 448 495 473 521 525 522 462 486 513 504
Then the chi-squared GOF test 'almost' rejects at the 5% level:
 q = sum((y-500)^2/500);  1-pchisq(q, 19)
 [1] 0.08381428
Note: A problem with any goodness-of-fit test on such a large sample is that even the slightest departure from the intended distribution (even one that is not of practical importance), can lead to rejection. Partly for this reason, some goodness-of-fit tests in statistical software are programmed not to accept samples larger than about 5000.
- 47,896
- 2
- 28
- 76
-
Is there any relation between the number of bins and sample size? Or is $5000$ the "limit" for any number of bins. Evidently having $1000$ bins doesn't make sense, but I think the limit should increase with the number of bins – Anvit Mar 22 '20 at 14:04
-
1You can't use so many bins that the expected frequency in each falls below 5. You have so much data that you could use more than 20 bins, which is not commonly done. There must be some optimum number of bins that maximizes power, but I don't know any rule for that offhand. In your case, power is not an issue. – BruceET Mar 22 '20 at 17:22

