Death rate
Using death rate may work when people that die have most likely acquired the virus locally.
However, for the moment, many people die because they acquired the virus during a visit to another area, or because they got it from another person that acquired the virus abroad.
Thus this death-rate based number is not very accurate unless the virus has fully spread out (in which case it will be more likely to get infected from a local source).
For the cases of Wuhan, Italy and other epi-centers, which have more spread due to local infections rather than foreign infections, death rate might be a good probe (although you still have to deal with the delay).
In addition, while death rate might be more trustworthy than total cases of infection (just think about the Germans, with lots of supplies, are testing with a lot of thousands of people, while neighboring countries, with limited supplies, are trying to limit the use of testing as much as possible), it is still a biased number. It is not easy to determine/pinpoint the cause of death. Often a multitude of diseases are present. If a person with cancer or aids gets a pneumonia from nCoV-19, then what is the cause? The sampling of 'cause of death' is not very clear and becomes part of the analysis.
Statistics are only usefull for a comparison when they have a similar underlying basis.
Edit 1 (these numbers where not available before): I know about the case of the Netherlands, they compared the number of reported covid deaths and the number of total deaths. They found an increase in death rate with about 2000 people per week, but the number of reported covid-19 death cases is only about 1000 per week. So there might be a lot of people that are missed in the statistics about covid-19 (another explanation could be that those half those 2000 people are covid-19 and the other half are something else, but that is unlikely). A lot of people are not appearing in the statistics because they do not die in a hospital (but instead in their own house or in a care home).
My view of these numbers is that the ubiquitous corona-case-dashboards and counters are flimsy and weak and are presenting dubious (biased) numbers. The underlying basis is doubtful when the numbers of different sources do not match.
If you do want to use death rate numbers than the more rigid total death rate seems to be the better numbers (that means death due to all causes and not just the reports about covid-19). But these numbers are often not easily obtained/present (at least not publicly and stratified on a local scale) like the picture of the distribution of the cases in the Netherlands
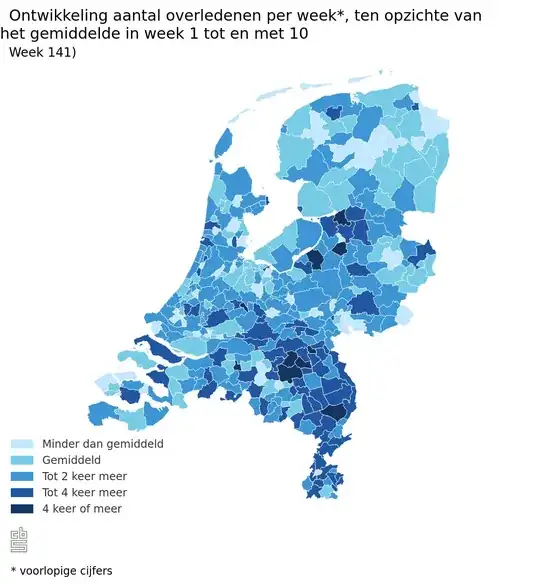 source: Centraal Bureau voor Statistiek
I have been trying to source this kind of stuff for multiple countries, but it is not easy. I imagine (hope) that this might be done behind the scenes on an international level. E.g. the euromomo project. But I do not know much about it and suspect that the data is mostly aggregrated at a national level (making it useless or at least not possible to make images like above) But I also imagine that governments are not spending time on getting these numbers accurate and instead waste their time on corona-apps.
Edit 2: I know of a research by the University of Oxford that has used exactly your approach of using the death rate in order to estimate the prevalence.
The problem is that they introduce a parameter $\rho$, the proportion of the population at risk, which is a very uncertain parameter. This parameter $\rho$ is together with the time between the introduction of the index case(s) and the first reported death a relatively simple transformation between the current number of deaths and the total infected population. A similar calculation, but more simple without the Bayesian stuff around, is done in this blog post.
Personally I am very skeptical about these calculations. There are some computations involved which make the appearance of a rigorous method. But effectively it is just scaling the current number of deaths with a factor in order to guestimate the current number of infected/immune people. The numbers involved in the determination of the scaling factor are very uncertain and biased. The posterior estimate of the number infected people is just as uncertain as the prior estimate of the factor $\rho$ and the time between first index case and first death (as well as other factors like estimates of growth rate and estimates of incubation time, and bias in reports about the number of deaths.... it is a big mess)
Travel data
The virus is mostly spreading out irregularly over a network. It spreads out differently at different scales, within the household, neighborhood, workplaces/schools, villages, agglomerations, countries, continents. You can sort of see the virus spread around with sudden jumps from large node/community to large node/community.
You can use occurrence of the virus in those nodes/communities as the variable (so you do not count individuals, since we do not know the presence in all individuals, but instead count the much better known presence of the virus in communities), and then use a model for the dynamics of the virus spreading between this different nodes in the network.
For instance. E.g. in region A you encounter x cases of disease among people that came from region B and y cases of disease among people that came from region C, while the travel to those regions is $r$ and $q$, then an estimate of the relative presence of the virus in regions B:C can be approximated by (x/r):(y/q).
I remember there was an early article on the spread of COVID-19 (I believe it was by Chinese scholars) that tried to estimate $R_0$ and included information about the frequency of travel between different regions.
Random tests
You can perform test on a sample from the population that does not show any symptoms and use the prevalence of the virus among this sample to make an estimate about the prevalence in the entire population.
If the prevalence is very small then this requires a very large sample which might be difficult. In that case one may perform the test among a sample where the suspicion of the prevalence is higher and gain some information about how many people have the virus in that group. Such a measure can be used to calibrate the estimates based on incomplete information (ie. along with other information, such as the rate at which people with the virus have the particular mild or severe symptoms, you get an idea about how much the current estimates are underestimating the true number of cases).
Edit 3 By now there have been a few of these type of screenings. For instance:
When more of these results come in we are able to make a much more rigid estimate about the spatial distribution and prevalence of the disease.

