1

I am trying to see the relation between Oceanic Nino Index (ONI) and Rainfall Anomaly Index (RAI).

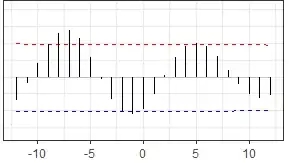
I have plotted the cross correlation plot in R ccf(ONI, RAI, lag.max=12), however I am not able to interpret it.

Both the ONI and RAI is available as monthly timeseries, however I have done the lags for only 12 lags.

CCF(ONI, RAI)

From the above plot it is observed that there is significant positive correlation at lag -6, -7 , -8 and significant negative correlation at lags -1 and -2. (Dashed line indicates the 5% significance level). However I am not able to get the clear association between ONI and RAI.

Can anyone help me interpret the relation between these two variables?
Nick Cox
  • 48,377
  • 8
  • 110
  • 156
  • 1
    As your question is (fairly) about interpretation, the fact that you produced the plot in R is immaterial and I have edited title and tags accordingly. You have interpreted the statistics correctly, modulo the need for some caution about applying several significance tests at once: the rest is climatology and oceanography! – Nick Cox Feb 28 '20 at 09:24
  • https://stats.stackexchange.com/questions/361674/correlation-of-non-stationary-time-series discusses the pitfalls of attempting to use the cross-correlation of time series data to suggest relationship. See also why we pre-whiten [![enter image description here](https://i.stack.imgur.com/sJvv8.png)](https://i.stack.imgur.com/sJvv8.png) – IrishStat Feb 28 '20 at 09:51

0 Answers0