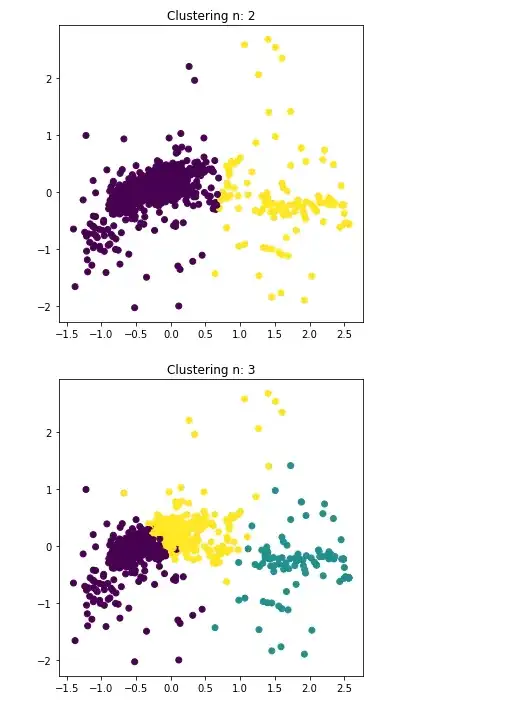
I am using kmeans for clustering and if I read the topics around here and somewhere else it is always recommended to do a graphical check-up for the number of clusters.
The problem is my orginal dataframe has 80 features. So I did a pca in python
pca = PCA(n_components=2)
X_pca = pca.fit_transform(data)
Is it ok to use this as analysis now? The output looks like this (only two dimensions):

Or do I miss something when I did the pca?