1

I have a dataset with 3 columns that are found out to be log-normally distributed. I am a little bit confused about how can I draw the conclusion in a log-normal distribution similar to Normal distribution(68 95 99.5 rule).

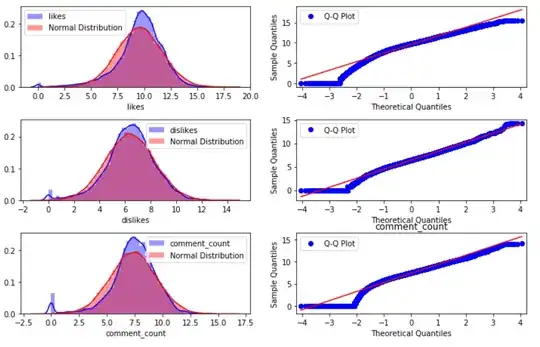
I have attached the screenshot of my log-normal distribution. But I am unable to interpret it. Here I used Q-Q plot to check if the data is log-normal
  • 3
    Your data cannot be log-normally distributed because it has an atom at zero (in all 3 cases). What exact question are you trying to answer about your data? – Chris Haug Feb 15 '20 at 13:59
  • @ChrisHaug I know it is not exactly log-normal. But if you remove those data points then it will be almost log-normal. I just want to know how can u interpret the data when it's log-normal distributed – Mrinali Gupta Feb 15 '20 at 14:25
  • 1
    Setting aside whether it is appropriate to just remove those zeros,, "interpret the data" is very vague. Again, what are you trying to find out about your data? – Chris Haug Feb 15 '20 at 15:10
  • 1
    I believe your interpretation may be faulty: these plots are much closer to censored Normal distributions than to any lognormal. For one explanation of how they arise, please see https://stats.stackexchange.com/a/30749/919, where (near the end) strikingly similar plots appear. – whuber Feb 15 '20 at 15:28

0 Answers0