0

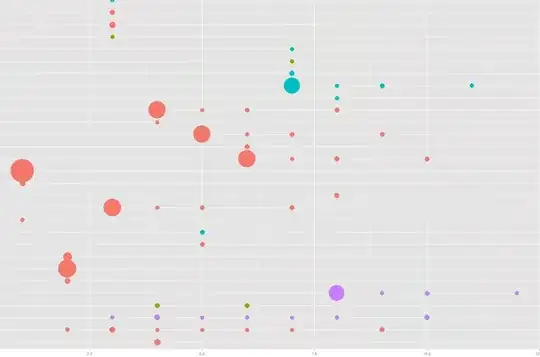
I have a collection of reviewers who are rating applications. Each application is reviewed by at least two people and they give a score between 0 and 50 among various criteria.

Looking at the mean for each reviewer, it's seems a few rated more harshly than others, and that they give disproportionately lower scores to applicants who by luck happen to get evaluated by more critical reviewers.

The mean of all applications reviews is 34.5. There are 22 reviewers, and their means range from 29.7 to 38.7. The standard deviation of population for all applications is 5.6.

I'm wondering how to go about adjusting the mean for reviewers to create a more equitable rating among all applicants, or if these numbers are within the normal expected variation. Thanks in advance.

enter image description here

jrue
  • 103
  • 3
  • How about using the z-score for each reviewer? In other words, it measures how much each score deviates from the mean. – inmybrain Feb 13 '20 at 07:36

2 Answers2

2

Hopefully this isn't overkill, but I think this is a case where creating a linear model, and looking at the estimated marginal means, would make sense. Estimated marginal means are adjusted for the other terms in the model. That is, the E.M. mean score for student A can be adjusted for the effect of Evaluator 1. That is, how much higher or lower Evaluator 1 tends to rate students relative to the other evaluators.

Minimally, you can conduct a classic anova to see if there is a significant effect of Evaluator.

I have an example of this below in R.

Edit: I suppose for this approach to make sense --- that is, be fair --- each evaluator should have evaluated relatively many students, and a random or representative cross-section of students. There is always a chance that an evaluator just happens to evaluate e.g. a group of poor students. In this case we would inaccurately suspect the evaluator of being a tough evaluator, when in fact it was just that their students were poor. But having multiple evaluators per student also makes this less likely.


Create some toy data

Data = read.table(header=T, text="
Student Evaluator Score
a       1         95
a       2         80
b       2         60
b       3         50
c       3         82
c       1         92
d       1         93
d       2         84
e       2         62
e       3         55
f       1         94
f       3         75
")

Data$Evaluator = factor(Data$Evaluator)

Create linear model

model = lm(Score ~ Student + Evaluator, data=Data)

Classic anova to see if there is an effect of Evaluator

require(car)

Anova(model)

   ### Anova Table (Type II tests)
   ###
   ###     Sum Sq Df F value   Pr(>F)   
   ### Student   1125.5  5  20.699 0.005834 **
   ### Evaluator  414.5  2  19.058 0.009021 **
   ### Residuals   43.5  4  

So, it looks like there is a significant effect of Evaluator.

Look at simple arithmetic means

require(FSA)

Summarize(Score ~ Student, data=Data)

   ###   Student n mean        sd min    Q1 median    Q3 max
   ### 1       a 2 87.5 10.606602  80 83.75   87.5 91.25  95
   ### 2       b 2 55.0  7.071068  50 52.50   55.0 57.50  60
   ### 3       c 2 87.0  7.071068  82 84.50   87.0 89.50  92
   ### 4       d 2 88.5  6.363961  84 86.25   88.5 90.75  93
   ### 5       e 2 58.5  4.949747  55 56.75   58.5 60.25  62
   ### 6       f 2 84.5 13.435029  75 79.75   84.5 89.25  94

Look at the adjusted means for Student

require(emmeans)

emmeans(model, ~ Student)

   ### Student emmean   SE df lower.CL upper.CL
   ### a         83.7 2.46  4     76.8     90.5
   ### b         59.4 2.46  4     52.6     66.2
   ### c         86.4 2.46  4     79.6     93.2
   ### d         84.7 2.46  4     77.8     91.5
   ### e         62.9 2.46  4     56.1     69.7
   ### f         83.9 2.46  4     77.1     90.7
   ### 
   ### Results are averaged over the levels of: Evaluator 
   ### Confidence level used: 0.95

Note that some students' scores went up and others went down relative to arithmetic means.
Sal Mangiafico
  • 7,128
  • 2
  • 10
  • 24
  • This is immensely helpful. I'm more of a Python user and a bit unfamiliar with these R functions. Would you happen to know the emmeans equivalent using the scipy library or similar? [Here is where I'm at](https://nbviewer.jupyter.org/urls/temp-j100.s3.amazonaws.com/scores.ipynb). – jrue Feb 14 '20 at 04:12
  • I'm really not that familiar with Python functions. What I've found is using R's emmeans function within Python via e.g. rpy2 (https://www.marsja.se/r-from-python-rpy2-tutorial/) – Sal Mangiafico Feb 14 '20 at 11:36
  • Also, in your results, it looks like you are treating Applicant as a numeric variable, when it should be a factor (nominal categorical) variable. – Sal Mangiafico Feb 14 '20 at 11:40
1

@Sal Mangiafico is on the right track, so I'd just add my few cents to his answer. The phenomenon you are describing is called examiner effect, and you can google for this term to find more hints on solving this problem.

Are you familiar with Item Response Theory? This is a theory, or rather a family of models used in psychometry for solving similar problems. The simplest of those models is the Rash model, where the $i$-th student's response (binary), to the $j$-th question is modelled using a latent variables model

$$ P(X_{ij} = 1) = \frac{\exp(\theta_i - \beta_j)}{1+\exp(\theta_i - \beta_j)} $$

where $\theta_i$ is the student's ability and $\beta_j$ is the item's difficulty. Of course, we can easily adapt the model to non-binary answers by not using the logistic function in here, or using something else, when we generalize the model structure as $E[X_{ij}] = g(\theta_i - \beta_j)$. As you can see, and as said by @Sal Mangiafico, this is just basically an ANOVA in disguise. Such models can be used for finding the "true" ability level of a student $\theta_i$, correcting for the difficulty of the questions. What @Sal Mangiafico described is exactly the same kind of model, but in his answer he assumed a fixed-effects model, while we would often assume a random- (or mixed-) effects models for such problems. You can find examples of re-defining IRT models, as mixed-effects models in the paper by De Boeck et al (2011).

De Boeck, P., Bakker, M., Zwitser, R., Nivard, M., Hofman, A., Tuerlinckx, F., & Partchev, I. (2011). [The estimation of item response models with the lmer function from the lme4 package in R.][6] *Journal of Statistical Software, 39*(12), 1-28.
Tim
  • 108,699
  • 20
  • 212
  • 390
  • 1
    Yes, good point. If I were doing the analysis and had several evaluators --- there's some discussion on a reasonable minimum number [here](https://stats.stackexchange.com/questions/37647/what-is-the-minimum-recommended-number-of-groups-for-a-random-effects-factor) --- I might treat Evaluator as a random effect in the model. ... I also think it makes sense to treat Evaluator as a fixed effect, especially if we are concerned with how tough these specific Evaluators are in their grading. – Sal Mangiafico Feb 13 '20 at 16:36
  • @SalMangiafico agree. – Tim Feb 13 '20 at 17:56