3

I have two samples, that I cannot assume come from the same distribution, with different means and variances and different sample sizes. The sizes are very different so I iteratively subsample the biggest one and perform a welsch test between with subsample and the other.

Let's say that in those iterations 8 out of 10 times I can reject H0.

Does it make sense to take the mean p-value out of those iterations as an indicator of significance?

update

Some problem details needed. The variable I am interested in comparing between the two groups is a mean frequency. The user takes can take some actions multiple times a month. This frequency is practically the actions per day for the month over the number of days in the month.

I hypothesize that the users in one group (the larger group) have a higher frequency than the users on the alternative group (which is smaller). The reason why I am performing a T-test is to validate this assumption.

LetsPlayYahtzee
  • 528
  • 1
  • 6
  • 17
  • 7
    **Absolutely not**. Can you provide some more details on what question you are trying to answer with the data? – Demetri Pananos Feb 11 '20 at 16:27
  • p-values are uniform random values, averaging them makes no sense whatsoever – Aksakal Feb 11 '20 at 16:33
  • 5
    For some insight into appropriate ways to combine p-values and the assumptions needed to do so, see https://stats.stackexchange.com/questions/20616 and https://stats.stackexchange.com/questions/340392. Your "iterative subsample" procedure will violate any of these assumptions; how do deal with it depends on the specifics of what you are doing. Could you provide the details? Or, better yet, why not just articulate the underlying question you are trying to solve and ask for solutions, rather than asking whether your proposed solution is meaningful? – whuber Feb 11 '20 at 16:35
  • @DemetriPananos I am measuring a rate between two cohorts of people. The test asseses if the two cohorts have a significant difference in the means of this rate (one cohort is expected to have a lower mean value). One cohort is ~10x bigger than the other. – LetsPlayYahtzee Feb 11 '20 at 16:38
  • 1
    @LetsPlayYahtzee Rate of what exactly? Is this measured with respect to something? If so, is this something discrete or continuous? As an example, is it a rate per 100,000 people or a fraction of something continuous like volume of some liquid? – Demetri Pananos Feb 11 '20 at 16:43
  • @LetsPlayYahtzee curious - why are you subsampling? Why not just compare the two samples? – roundsquare Feb 11 '20 at 16:45
  • @roundsquare I am not sure if comparing two samples with very different sizes is okay. The p-value is 0 when comparing the two samples without sub-sampling. I was wary about this. Do you think it's okay? – LetsPlayYahtzee Feb 11 '20 at 16:47
  • @DemetriPananos it's actions taken per day, so it's discrete. – LetsPlayYahtzee Feb 11 '20 at 16:47
  • 1
    @LetsPlayYahtzee Do you have several measurements for the same person? The reason you are getting a p value so small is because the sample size is likely so big. With large data, you are powered to find minuscule effects. No two groups will have identical means, and so these hypothesis tests become straw men. It would be much better if you edited your question with complete details of the problem rather than requiring us to ask piecemeal. – Demetri Pananos Feb 11 '20 at 16:49
  • @DemetriPananos I wasn't aware that those details are required for the question I ask. It's still a bit unclear to me what you mean. Do you suggest I should subsample to assess the difference? Thx for the help – LetsPlayYahtzee Feb 11 '20 at 16:55
  • @whuber is it clearer now? – LetsPlayYahtzee Feb 11 '20 at 17:04
  • 2
    I don't get why or how you are subsampling. The usual tests to compare two means do not require samples of equal sizes. – whuber Feb 11 '20 at 17:17
  • My goal is to assess the impact of being in the cohort has to the mean frequency that I described above. If compare two wildly different samples I am afraid that the reported difference will be inflated. As @DemetriPananos pointed out, no two groups are the same. So when comparing two samples I want them to have similar sizes. Isn't a bit like comparing apples with oranges if the two are widly different in size? – LetsPlayYahtzee Feb 11 '20 at 17:23
  • No it isn't like comparing apples and oranges. You're comparing means with means. Whuber has already stated "the usual tests to compare two means do not require samples of equal sizes". – Glen_b Feb 11 '20 at 21:58
  • 1
    @LetsPlayYahtzee to be clear, the math behind the t-test accounts for the difference in sample size. Because of that, you don't need to jump through any hoops to account for it.That being said, Demetri Pananos's point about large samples detecting minuscule differences, so small they may not matter for practical purposes, is important. However, the thing to do is not to sub-sample but, instead, to test to see if the the difference is big enough to matter (a threshold you need to set based on the reason you are doing the test). – roundsquare Feb 11 '20 at 22:25

2 Answers2

1

If your group sizes are large enough, you are well powered to detect effects so small as to essentially be useless. Here is an example in R. I generate 200,000 observations from two groups whose means differ by 0.01.

library(tidyverse)


replicate(1000,{
  x = rnorm(200000)
  y = rnorm(200000, 0.01, 1)

  t.test(x,y)$p.value<0.05
}) %>% mean

I correctly reject the null 88% of the time, but the result of my test is quite uninteresting because the difference is so small (EDIT: I guess small is relative here. I'm sure a 1% difference in some applications is worth thousands of dollars). As I said in the comments, no two groups are exactly identical and so with enough data, that will be demonstrated.

So what are some ways we can deal with this? We can abandon significance testing all together and instead opt for estimation. Whatever your metric of interest is, you could instead create confidence intervals for the mean outcome per group. I highly suspect this is for an internet AB test, so you could say something along the lines of "our intervention yielded an effect between x and y, as compared to control which was w and z". You could use the t-test to compute a confidence interval for the difference in the means, which might be even more useful.

Demetri Pananos
  • 24,380
  • 1
  • 36
  • 94
  • My problem here is that one is much larger than the other. My goal is to assess the effect that being in the second cohort has on the mean frequency. Should I be okay to compare the two cohort means, even if the two groups are wildly different in size? – LetsPlayYahtzee Feb 11 '20 at 17:24
  • @LetsPlayYahtzee I've already addressed that large samples can make traditional tests straw men. It is much better to instead provide estimates of your outcome per group. There is nothing preventing you from using a statistical test on each group, but as I've indicated a p-value is not the whole story. – Demetri Pananos Feb 11 '20 at 17:31
  • 1
    So you are suggesting computing the confidence intervals in each group separately and compate the two ranges for the groups respectively. Am I understanding this correctly? – LetsPlayYahtzee Feb 11 '20 at 17:35
  • 1
    @LetsPlayYahtzee Yes. P-values at this time are not as informative as we would hope they would be. – Demetri Pananos Feb 11 '20 at 17:39
  • To make sure I understand this, would you use something like bootstrapping to calculate what the distribution of differences is inside each group, and from this establish the confidence threshold. – LetsPlayYahtzee Feb 11 '20 at 19:19
  • 1
    @LetsPlayYahtzee You don't have to do that. You can compute the difference and then compute the confidence interval using a pooled estimate of the standard error. https://ncss-wpengine.netdna-ssl.com/wp-content/themes/ncss/pdf/Procedures/PASS/Confidence_Intervals_for_the_Difference_Between_Two_Means.pdf – Demetri Pananos Feb 11 '20 at 19:26
  • something else I should have mentioned, my data does not follow the normal distribution. – LetsPlayYahtzee Feb 11 '20 at 19:32
  • 1
    @LetsPlayYahtzee It doesn't have to be normal. The central limit theorem says that with enough data, the sampling distribution of the sample mean is normal with mean equal to the population mean and standard deviation equal to the standard error. – Demetri Pananos Feb 11 '20 at 19:33
  • Let us [continue this discussion in chat](https://chat.stackexchange.com/rooms/104337/discussion-between-letsplayyahtzee-and-demetri-pananos). – LetsPlayYahtzee Feb 11 '20 at 19:41
1

It seems that the OP is mainly concerned with conducting a t-test for unequal sample sizes.

However, imbalanced sample sizes are in general not a huge problem when applying the t-Test. The t-test is actually very stable against sample size characteristics as deviations from normal distribution and imbalanced sample sizes (if sample sizes are large enough!). Small simulations are following to illustrate this:

p.value <- c()
n.sim <- 1e5
for(i in 1:n.sim){
  x1 <- rnorm(n=100,mean=1,sd=1)
  x2 <- rnorm(n=1000,mean=1,sd=1)
  p.value[i] <- t.test(x1, x2)$p.value
}
sum(p.value<0.05)/n.sim
> [1] 0.05083

As you see, no increase of type I error rate. I have assumed that both samples come from a normal distributions, though. Let's consider a completely different distribution, e.g. two very different Gamma distributions but with the same mean (mean is shape divided by rate):

p.value <- c()
n.sim <- 1e5
for(i in 1:n.sim){
  x1 <- rgamma(n=100,shape=1,rate=1)
  x2 <- rgamma(n=1000,shape=10,rate=10)
  p.value[i] <- t.test(x1, x2)$p.value
}
sum(p.value<0.05)/n.sim
> [1] 0.05749

Slightly increased type I error rate. Whether this is serious enough to prevent from using a t-test is debatable. Taking a look at the distribution of p-values might be insightful, too. Under the null hypothesis, p-values should be uniformly distributed, and it looks pretty much like it: enter image description here

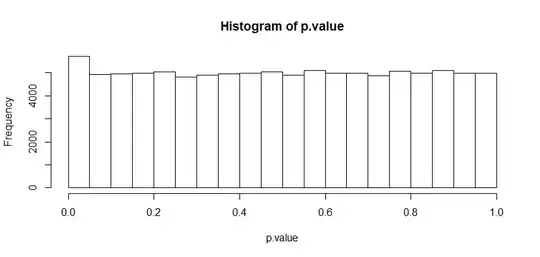
Note that this problem will become more serious, when your sample sizes are smaller than what I assumed, e.g. for the last example with the sample sizes being 10 and 100 instead, the type I error rate becomes 0.10177.

What happens if we take subsamples from the larger group, calculate the p.value each time, and then average these p.values?

p.value <- c()
pvalue2 <- c()
n.sim <- 1e5
for(i in 1:n.sim){
  x1 <- rgamma(n=100,shape=1,rate=1)
  x2 <- rgamma(n=1000,shape=10,rate=10)
  for(j in 1:10){
    x2.sub <- x2[((j-1)*100+1):(j*100)]
    pvalue2[j] <- t.test(x1, x2.sub)$p.value
  }
  p.value[i] <- mean(pvalue2)
}
sum(p.value<0.05)/n.sim
> [1] 0.03909

Seems something might be off with the type I error rate. But it gets really interesting if we take a look at the distribution of p-values. enter image description here Doesn't look like a uniform distribution at all anymore! With imbalanced sample sizes we are far better off than with taking the mean of p-values for several subsamples.

LuckyPal
  • 1,512
  • 7
  • 15