2

I am trying to identify an ARIMA model for the following time series: Time series
According to the ADF test, it is stationary (p-value = 0.0144). When I use the ACF and PACF, both show correlation without a typical pattern:

enter image description here

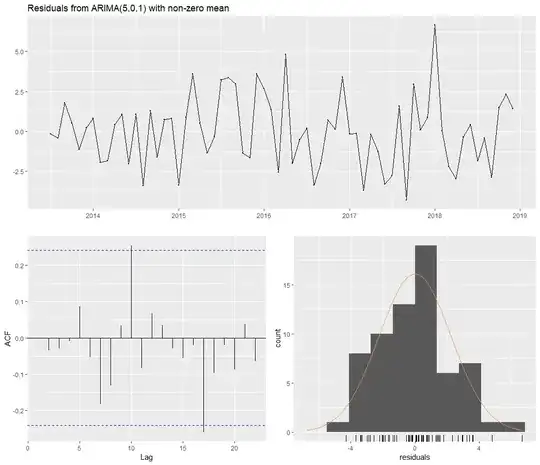
After using auto arima with tracking, all the options that come out show autocorrelation of the residuals, except for one that shows not much autocorrelation and a Ljung box test with a P=0.08:

enter image description here

Nonetheless, not every parameter in the model shows statistical significance:

z test of coefficients:

           Estimate Std. Error z value  Pr(>|z|)  

ar1       -0.466242   0.146513 -3.1822  0.001461 **     
ar2        0.153763   0.131994  1.1649  0.244048    
ar3        0.071273   0.131992  0.5400  0.589212    
ar4        0.017179   0.130615  0.1315  0.895361    
ar5       -0.318828   0.117431 -2.7150  0.006627 **     
ma1        0.833638   0.108197  7.7048 1.311e-14 ***    
intercept 15.836490   0.328744 48.1727 < 2.2e-16 ***

I was wondering if in this case, it is better to select this model given the lack of final autocorrelation over others that show the statistical significance of the parameters but with a correlation of the residuals. Or if I am doiing something wrong with this series?

Here is a link for the file: https://drive.google.com/open?id=1lHJx-sR32ZQW-3FVnu45jHiVtneSF44Y

Thank you in advance!
Richard Hardy
  • 54,375
  • 10
  • 95
  • 219
edct40
  • 23
  • 3
  • 1
    Here is a whole post on why statistical significance is not to be used for model selection: Hyndman ["Statistical tests for variable selection"](https://robjhyndman.com/hyndsight/tests2/). – Richard Hardy Feb 08 '20 at 16:40
  • 1
    Just to note: you have accepted an answer that contradicts a post by one of the globally leading time series forecasters, providing good examples and citing a credible textbook. The answer also contradicts model selection theories on which AIC and BIC are based. – Richard Hardy Feb 09 '20 at 11:36
  • Dear @RichardHardy, agree with what you mentioned about Dr. Hyndman and I really appreciate your comment :) Thank you in advance – edct40 Feb 10 '20 at 15:32
  • Thank you. It was not more than a note, but I though it is important that you get it. Good luck with your models! – Richard Hardy Feb 10 '20 at 16:00

1 Answers1

2

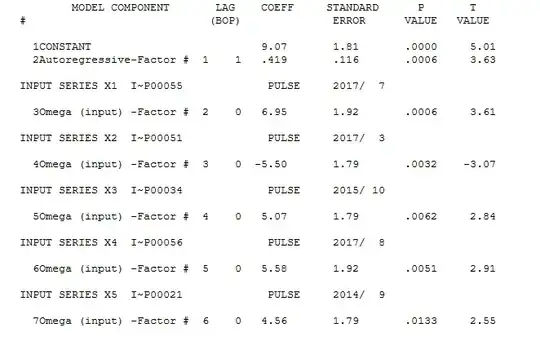
in my opinion NO . As over-enter image description hereparametization significantly inflated forecast prediction intervals. Your data set suggests a very simple (1,0,0)(0,0,0) with 5 identified anomalies . Here is the model enter image description here with a residual ACF showing sufficiency.

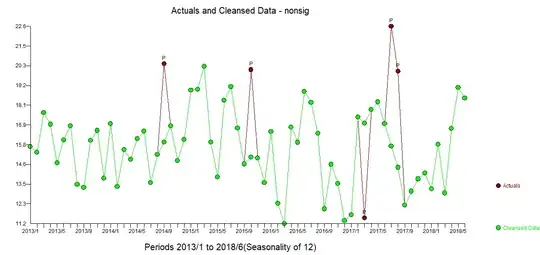
The Actual/Fit and Forecast graph is here enter image description here with Actual and Cleansed graph here enter image description here

The acf and the pacf of the original data is affected by the anomalous data points .It is fairly well known but not always reflected on that the acf and the pacf should be based on data conditional upon any latent deterministic structure ( in this case a few anomalies) . See @Adamo's comments here Interrupted Time Series Analysis - ARIMAX for High Frequency Biological Data? . The simple reason your solution failed was it was trying to simply fit ANOMALOUS DATA POINTS as compared to isolating their effect. In a two step procedure , AUTOBOX identified the anomalies and then efficiently identified the ar(1) structure ...Two iterations .

ARIMA model identification ( https://autobox.com/pdfs/ARIMA%20FLOW%20CHART.pdf ) is an iterative process not just trying a list of models which are often heavily over-parameterized yielding non-significant structure. Models/Theory should be as simple as possible but not too simple ... Einstein ....Box and others ! I used the AUTOBOX automatic procedure which I have helped to develop.

The 5 unusual points are very clear once you take into account the ar(1) structure. If you don't take into account the 5 unusual points , the picture is "muddled" or affected by the "unusual"

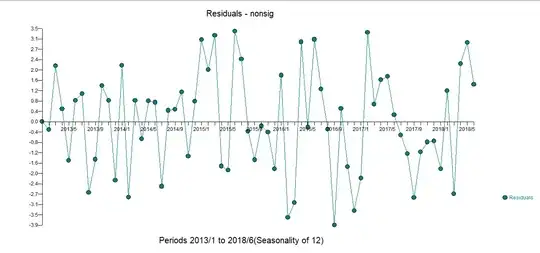
The plot of the residuals is nice and clean here enter image description here

IrishStat
  • 27,906
  • 5
  • 29
  • 55
  • Thank you very much for your kind answers (@IrishStat and @Richard Hardy)! They have been very helpful! – edct40 Feb 08 '20 at 17:40
  • Dear @IrishStatm I was wondering what method did you use in your answer? Thank you in advance – edct40 Feb 10 '20 at 15:39
  • 1
    i used AUTOBOX which iterated to combine both memory and pulses. Pulse detection was based upon Tsay"s and others approach http://docplayer.net/12080848-Outliers-level-shifts-and-variance-changes-in-time-series.html . If I can help further please let me know. – IrishStat Feb 10 '20 at 16:29
  • Thank you very much! @IrishStat – edct40 Feb 10 '20 at 16:33