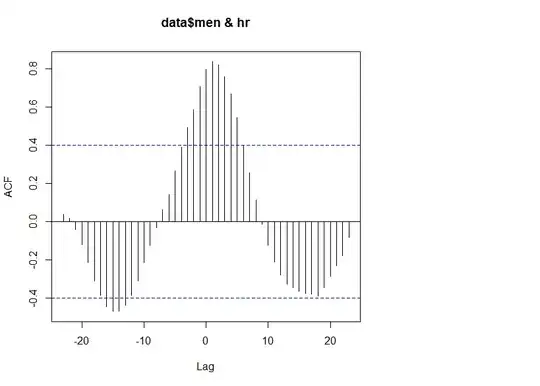
I am trying to build SARIMAX model, trying to determine the (p,d,q) & (P,D,Q,s) values from ACF, PACF plots. My series is stationary without any differencing being required (based on ADF test). While I understand from PACF plot that p=2 & q=2 (though ACF is decaying exponentially, I believe it could be due to cumulative effect of lags on each other) should be good enough, I am slightly confused as to how I can arrive at the P,Q values for the seasonal part. My data is daily observations collected for about 4 years. From the below seasonal part of the decomposition, I could see that pattern repeats itself for every 7 days. Here is the ACF, PACF plots for the undifferenced original data.
I am also confused on the 's' value in (P,D,Q,s) whether to consider as 365 (as data is daily observations) or 7 ( as the pattern repeats itself every week).
Appreciate your guidance in helping me identify the P,Q values for the seasonal part of the series.


