4

I'm using a time-series model to do weekly forecasts on the number of incoming calls to a company. This variable has a weekly 'in-month' pattern and a monthly 'in year' pattern, and i have data from 2008-01-01 to 2012-08-31.

To explain it better: Mondays show peaks along weeks, and rainy months show peaks along the year.

My idea is to take the week-forecast point and 'distribute' it along the week days, using the weekly-pattern information.

What is a good technique to do this? Empirical density distributions maybe? My tools: R language.

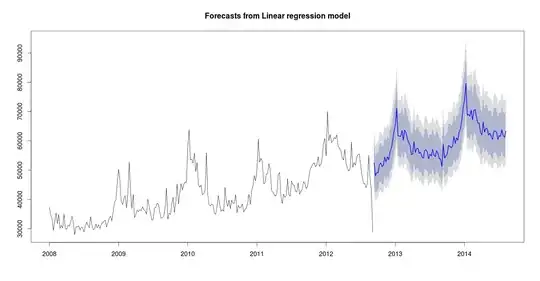
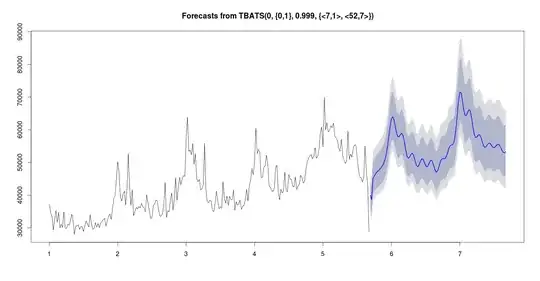
Edit: Below, weekly forecasts using 2 different methods.

Results from tbats using the forecast package: enter image description here

Results from tslm using the forecast package: enter image description here

Stephan Kolassa
  • 95,027
  • 13
  • 197
  • 357
Fernando
  • 741
  • 8
  • 24

2 Answers2

6

Your approach is one possibility.

On the other hand, call center forecasting is an active area of research, and there are many people working in this field. One standard way of doing this is adding additional seasonal components to seasonal Exponential Smoothing, so you have one component for yearly and one component for weekly seasonality. You could even go down to hourly data and add another component for intra-daily seasonality, since calls will arrive in different quantities during the morning, the lunch hour, the afternoon and the night. This article, along with the following comments, may help you. Or this one by the same author.

I recommend that you google for "call center forecasting". Electricity demand has similar issues with intra-weekly and intra-daily seasonality, so searching for keywords along this direction will also help.

Stephan Kolassa
  • 95,027
  • 13
  • 197
  • 357
  • Thanks, i'll take a look. My week-based model gives good results, what i really need is a simple way to split the week-mean across the weekdays. – Fernando Nov 29 '12 at 16:14
  • A simple way would be to calculate the percentage of each week's calls to arrive on Monday, on Tuesday etc., to exponentially smoothe this series for each day of the week and to reapply the result. – Stephan Kolassa Nov 29 '12 at 16:20
  • You mean, use one weekly model to get the mean forecast, then apply the weights, OR build a separate model for each day o the week? Thanks! – Fernando Nov 29 '12 at 16:23
  • The first alternative: forecast total weekly arrivals, and separately forecast the percentage of this total to arrive on Monday, Tuesday, etc. Then apply the forecasted percentages to the forecasted total. (Of course, the forecasted percentages will probably not add up exactly to 100%, so you will have to renormalize.) – Stephan Kolassa Nov 29 '12 at 16:28
  • So for every daily point of my dataset, i can take the percentage based on the current week, to build a new historic. Right? And thanks again, i liked this solution. – Fernando Nov 29 '12 at 16:36
  • Well your method works, but i'm having troubles to get these percentages. The number of weeks in a year is not exact, so at some points it gives me wrong values...can you suggest another approach? I could use ecdf() or density(), but i'm not sure how! – Fernando Nov 29 '12 at 20:23
  • Could you edit your question to include a subset of your data (the output of `dput()`)? – Stephan Kolassa Nov 29 '12 at 20:29
  • The data is too long to paste even a subset, but i edited the question to explain the data format. Regarding the total week -> week day transformation, the simpler approach the better! – Fernando Nov 30 '12 at 12:39
  • It looks like you are successful with @RobHyndman's approach - if you still want me to go into details, please tell me... if not, I'll be busy reading Rob's article ;-) – Stephan Kolassa Nov 30 '12 at 19:17
  • Yes, `tbats` did the trick. Not only i get better weekly-forecasts, but now the daily forecasts works as well (using 7, 31 and 365 as seasonal periods). I'm just curious in how would you proceed to split the mean across the week-days (without using percentages). – Fernando Nov 30 '12 at 19:55
3

Since you are working in R, you might try the dshw() or tbats() functions from the forecast package. dshw() implements Taylor's double seasonal Holt-Winters method (referred to be @Stephan) to handle both seasonal periods. tbats() is more general, and implements the TBATS model from De Livera, Hyndman and Snyder (JASA, 2011). DSHW is a special case of this.

Rob Hyndman
  • 51,928
  • 23
  • 126
  • 178
  • @fernando, do u mind sharing your code? – user1471980 Nov 30 '12 at 12:54
  • I got great results using `tbats`, but i have a question: right now i'm using `tslm` with rainfall data as a regressor, which works fine (see post images). About 70% of time, there's no rain, is a good idea to take the average between these 2 models? thanks! – Fernando Nov 30 '12 at 13:08
  • @user1471980 The code is very simple, just check ?tbats or ?tslm. – Fernando Nov 30 '12 at 15:57
  • @Rob, I used the xreg parameter in tbats, and the results were the same as the model without the regressor. Is this normal? Thanks! – Fernando Nov 30 '12 at 19:32
  • @Fernando. tbats() does not have an xreg argument. If you include one it will be ignored. – Rob Hyndman Dec 01 '12 at 00:19