I recognize that image!
[Since that hint was apparently overly subtle, you should - in accordance with the stackexchange rules - credit the person who created it and link to where you got it from. Since it was originally posted here on stackexchange, it should not be too difficult to figure out who to credit.]
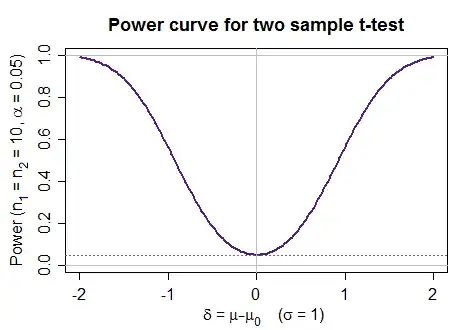
High power is better whenever the null is false, so at a fixed significance level, the steeper the curve rises toward 1 (where it would always reject), the better, and the shallower, the worse it is (the more often you fail to reject when you should).
Here's a sequence of power curves for a two tailed symmetric test, like a two-tailed t-test, say.
The flatter curves (which are red-orange in the plot, apart from the totally flat one in grey) are relatively poor -- power is comparatively low while the steeper (bluer) ones are relatively good - power jumps up very near 1 as soon as the difference moves a little distance from the null value.
For a one tailed test you want the rejection rate to not exceed the significance level on the part where the alternative doesn't hold (rejection rate $\leq \alpha$) and then on the part where the alternative does hold, for it to rise as rapidly as possible toward 1.
Ideally, in whichever case, you reject when the null is false, so you would like power to be at 1 everywhere the null is false. This is usually not attainable in practice.
For some situations, there may be a uniformly most powerful test; in particular you might like to read about the Karlin-Rubin theorem. In such a case, for a given set of assumptions and sample size there may be a "best" power curve you can attain under those assumptions across a sequence of alternatives (though you can do better by increasing the sample size).
Even when there isn't a single "best" test, you can compare different tests under some particular sequence of alternatives.
For example, there's plots showing some comparisons of different tests in specific situations (both in question and answer) in this question How to graph Wilcoxon test power R
It is sometimes the case that a power curve dips below the significance level when the alternative is true; in particular this is the case with some omnibus-alternative tests (like goodness of fit tests). Such tests are said to be biased.