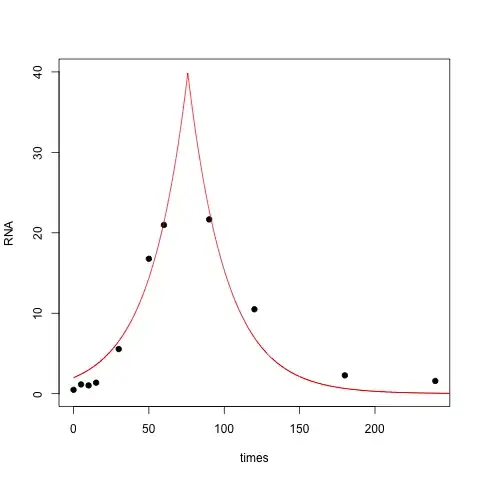
You could do all this with a GAM and allow the model to identify the shape of the deterministic relationship, then answer your questions using the posterior distribution of the model.
You can use a cyclic cubic regression spline to constrain the end points of 0 and 24 to be the same. For example:
knots <- list(ToD = c(0, 24))
m <- gam(y ~ s(ToD, bs = 'cc', k = 15), data = df, method = 'REML',
         family = XXXX, knots = knots)
where XXXX is a suitable family for the conditional distribution of the response variable.
Your questions could be addressed as follows:
You can get this evaluating the estimated smooth function s(ToD) at a fine grid over the range of ToD and then ask at which point in that range is the maximum reached. You can use posterior simulation to generate the uncertainty in that time also. See this answer that I provided on a related problem (it is essentially the same issue): https://stats.stackexchange.com/a/191489/1390
One answer to this could be gleaned directly from the Wald-like test shown when you look at the summary of the model. Strictly this would be a test of the null hypothesis that the smooth function is equal to 0.
A more direct test would be to proceed as per question/answer 1 and instead of finding the maximum of the curve, find the minimum and the maximum and their difference, and repeat using posterior simulation to put an uncertainty estimate on the amplitude.
You could formulate this as a test on the difference of the derivatives of the estimate smooth functions over some time period before and after the maximum. Again, evaluate the derivative over the two time intervals, compute the absolute difference of these derivatives as the point estimate for asymmetry and then repeat the process as above on a large number of draws from the posterior distribution to get an estimate of the uncertainty.
If you provide some example data I could add some code examples in R to show you what I mean/illustrate what I'm getting at with the above.

