When we define confidence intervals or error bars, as I understand it, we usually deal with the standard deviation when it comes to Gaussian statistics. That is to say, $68.27\%$ of the data will lie within $\pm \sigma$ around the mean (in the Gaussian case also the median).
Unless I am mistaken, one can use the standard deviation as a metric to define confidence intervals or error bars on data. I.e. $1\sigma = 68.27\%$, $2\sigma = 95.45\%$, and so on. Defining confidence intervals or error bars in this way is especially useful when weighting data, which as I understand it for Gaussian statistics is $1/\sigma^{2}$.
My questions are if we are dealing with non-Gaussian, asymmetric probability density functions -- for example the Rayleigh distribution $$R(\sigma, x) = \frac{x}{\sigma^{2}}e^{-x^{2}/(2\sigma^{2})}$$ How do we define a confidence interval, or something analogous to the standard deviation for non-Gaussian distributions?
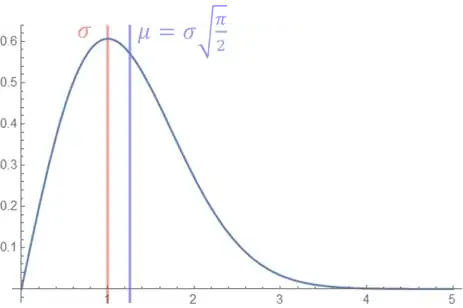
My first thought is that we must determine the mean, or expected value of the distribution and we can do that by $$\mu = E(x) = \int x f(x) \ dx$$ -- $f(x)$ being the distribution we are interested in. In the case of the Rayleigh distribution this comes out as $$\mu = \sigma \sqrt{\pi/2}$$.
Here the shape parameter, $\sigma$ is shown in blue and the mean as described above in red.
Given that I am interested in looking for something some what similar to a standard deviation for use as an error bar or a confidence interval, and given that the distribution is asymmetric, I would also expect the error bar to interval to be asymmetric i.e. $$x^{\sigma_{+}}_{\sigma_{-}}$$
I would determine $\sigma_{+}$ and $\sigma_{-}$ by first defining a proportion of data I want to find e.g. $0.6827$ and then perform the following inetgrations $$\int_{\sigma_{-}}^{\sigma \sqrt{\pi/2}} R(\sigma, x) \ dx = \frac{0.6827}{2}$$ $$\int_{\sigma \sqrt{\pi/2}}^{\sigma_{+}} R(\sigma, x) \ dx = \frac{0.6827}{2}$$ Solving both for $\sigma_-$ and $\sigma_+$ gives the error bar or confidence interval.
First Question:
Is the approach I have described above reasonable? If not, what should I look at?
Second Question:
How does one apply weights when dealing with non-Gaussian statistics? Clearly if one has an asymmetric error bar $1/\sigma^{2}$ will not work.
I clearly have misunderstood the difference between an error bar and a confidence interval -- there is a very good explanation given in one of the comments to this question -- thanks very much to this user!
I think perhaps a better question is then:
Given I understand the distribution from which my data is drawn, what is the best approach of generating a confidence interval for use in fitting and extracting unobserved parameters. For example if I have a function which could be noised additively or multiplicatively, for example $$f(t) = A \sin(\omega t) + \xi(t)$$ or $$f(t) = A \sin(\omega t) \xi(t)$$ where $\xi(t)$ is drawn from some non-Gaussian distribution. If I then have knowledge of the distribution from which $\xi(t)$ is drawn, is it possible (or even necessary) to generate a confidence interval for this data set for use in fitting, to act as a weight?
Or is a confidence interval only useful for giving information about the fit itself?
