This is a feature that I came across in Mixpanel and really enjoy it, but I haven't figure out how to do it myself (so I can use it on some other dataset).
Use case
I have a funnel (which I defined myself), and looks like this
For step 1's data, there are many attributes/segments, such as
- user's country
- user's traffic source (where they come from)
- user's device (ios, android, web etc.)
- user's age
- last purchase day (R for RFM)
- purchase frequency and percentile level(F for RFM)
- purchase amount and percentil level(M for RFM)
- shop category preference
- ltv
and many others
The goal is to identify interesting segments. For example, maybe the user with ios device has much higher conversion rate than other devices.
My question
Now, instead of manually group by the funnel's 1st step by device and other each attributes, can I do it with loop through or any algos? is there any industry best practice for doing this kind of analysis?
Background and resources
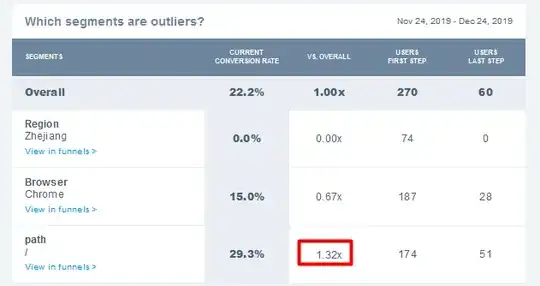
Some output from Mixpanel (which is really interesting)
(1) Time comparison
This detects the segment driving the conversion rate change between differet time periods
(2) Outlier segment
Docs can be find here: https://help.mixpanel.com/hc/en-us/articles/360031788492-Find-Interesting-Segments


