3

Hello, all. When it comes to calculating the average from some time-spanning date, let's say the average of 20 weekly sales records from a specific store - while also calculating the standard deviation of said average value - is it possible to scale these two estimators to another time period?

Essentially, what I am asking is whether non-Normal distributions can be added together, like in the Gaussian case.

In Finance, for example, scaling $\sigma$ between time periods, under Gaussian assumptions, is a simple calculation - just multiply the original by square root of the next time period.

(image lightly relevant)
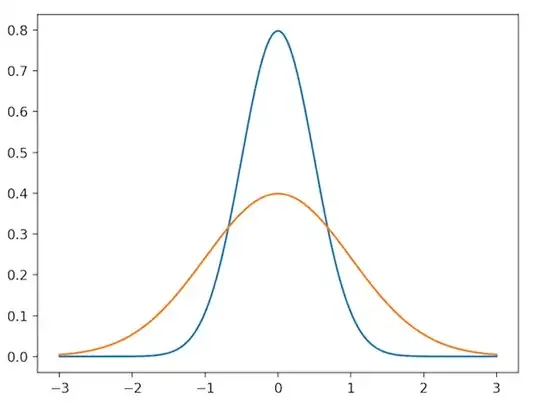
enter image description here

Coolio2654
  • 642
  • 5
  • 17

1 Answers1

1

If they are independent, identically distributed (IID) normal random variables, you simple add the means from period to period, and the stdev is the square root of the sum of the squares of the stdevs of each observation. So, if you have 1 week of "typical" data, a year's worth of prediction is 52 times the mean, but only about 7 times the weekly stdev (actually square root of 52, but 52 is very close being the square root of 49).

The reason is that, for a normal distribution, we often talk about the mean an standard deviation. stdev is easier to visualize, but the real parameters for a normal distribution is the mean (average, which sums) and variance, which is sigma-squared where "sigma" is the stdev.

If your example is for real, though, I would worry about seasonality, which could make a big difference in your thinking.

eSurfsnake
  • 1,004
  • 5
  • 13
  • So that does sound like the Finance example I posted, huh. More importantly, however, does a similar rule hold for arbitrary distributions, or even stranger ones like mixture distributions? If one wanted to add Gamma distributions in the same way, for example, with their $\alpha$ and $\beta$, is it possible? – Coolio2654 Dec 19 '19 at 04:33
  • For most distributions it isn't so easy. If it is simply a matter of "scaling", look up the dristribution on wikipedia and they have good pictures showing how the shape changes. One of the nice things is that the normal distribution scales easily. But, for example, look at the chi-squared distribution (which is the square of the normal) and you will see that as you increase its parameter, the shape changes. – eSurfsnake Dec 26 '19 at 17:51