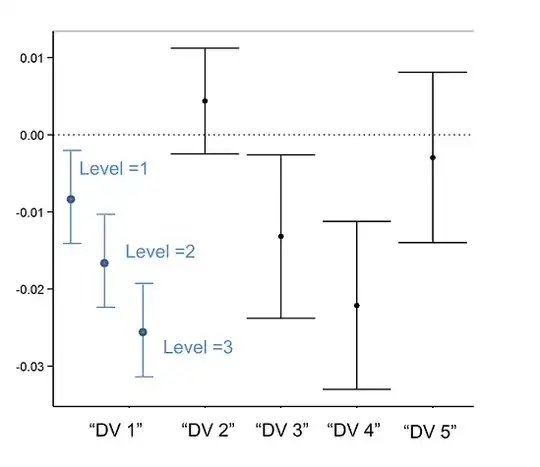
)
My problem is that I have HR for a factor named "Selvrisiko" and I get the
output estimates (HR) (Upper bound) (Lower bound) as:
but when I plot (Kaplan - Meier) cumulative hazard for the groups I get:
Interpretation:
group 5262 and 7015 has higer risk than 3509 while 8769 has not
but when I look at the graph it seems that the group 8769 is acutally in higher risk than 3509
What is wong? Is my Interpretation correct?

