2

Data: daily spread (highest price - lowest price at a given day) of Bitcoin, Ethereum and Ripple. The spread values are an absolute amount in US$.

Bitcoin is worth much more than the other two and Ethereum is worth much more than Ripple, so when I plot the daily spreads I get this: enter image description here
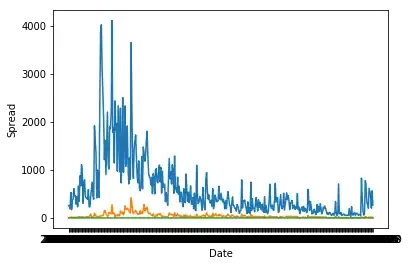
BTC: blue, ETH: orange, XRP: green.

How do I plot each currency's volatility without taking in consideration their price? I just want to compare which one i more volatile and how the volatility changes over time.

Code in Python/matplotlib.pyplot

Richard Hardy
  • 54,375
  • 10
  • 95
  • 219

1 Answers1

2

An established unit-free measure of variation is the coefficient of variation (SD divided by mean). I'm not sure how you would compute the SD in your case.

You might use the daily range divided by median (or midrange). In principle, assuming efficient exchange markets among major currencies, such a measure (like the coefficient of variation) would be the same whether computed in dollars, pounds or euros. –

BruceET
  • 47,896
  • 2
  • 28
  • 76