[Edit] I am working in R.
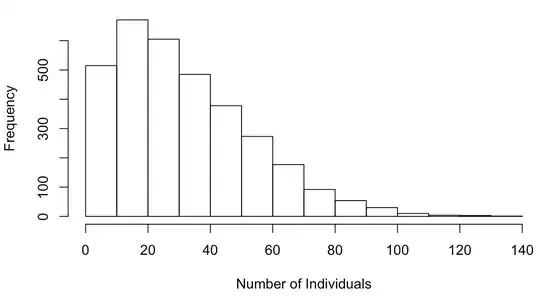
I am investigating the effects of weather on restaurant demand. My DV is the number of restaurant visitors per hour, my IVs are five weather variables and all other variables are control variables. Below you can find a frequency plot of my DV:
After finding out that a multiple regression does not suit my data (i.e. my DV is a non-negative, discrete count variable), I decided to proceed with Poisson GLM. The code (simplified) is as follows:
    glm(formula = Visitors ~ Temperature + Temperature_Squared + Pressure
+ Clouds + Sun + Rain + Day_Fri + Day_Sat + Day_Sun + Day_Mon
+ Day_Tue + Day_Wed + Hour_00 + Hour_01 + Hour_02 + Hour_13
+ Hour_14 + Hour_15 + Hour_16 + Hour_17 + Hour_18 + Hour_19
+ Hour_20 + Hour_21 + Hour_22 + Hour_23 + Holiday, family = "poisson" , data=dat)
I ran a dispersion test, returning the following results:

Although the dispersiontest is significant (= overdispersion), the alpha is close to zero (zero = equidispersion). What does this imply for my next steps and model selection?
I ran the same model as above with
family = "quasipoisson"and then ran the comparison as proposed by Tom Wenseleers here:pchisq(summary(poisson)$dispersion * quasipoisson$df.residual, quasipoisson1$df.residual, lower = F). This returns 0.4967107. How do I interpret this value? Is my Poisson or QuasiPoisson model better?I am also considering a Negative Binomial model. However, looking at the typical distribution of such models online (high frequency of low counts and extremely long tail), it does not seem to align with my data as provided in the frequency plot above. Can (should) I still proceed with this?
As you can see, I am pretty puzzled by all models, how to compare them and which one to pick. Hopefully, you can help me sort things out.
