I am doing a study on StackExchange. The management of StackExchange has demodded (for unclear reasons) a moderator, and now the network is on fire.
Currently many moderators resign or suspend their activities because they are dissatisfied. I wish to gather and analyse data about these resignations. I like to find out whether there is an increase or decrease of dissatisfaction and whether this is statistically significant.
- What kind of test can I perform to find this out? In particular I need some guidance on how to analyze/model/define this increase (the problem is that I have no simple linear model that I can fit to the time of events, it might be non-linear, so how to deal with that).
I am planning to use this petition letter and this list of resignations to define events. How can I combine all this into a single model?
For data stamps I am thinking about using the posts on meta-sites rather than to look for it in the text.
The event types I wish to collect because possibly more data might allow me to have more power in my test?
I am thinking about creating something like a table that looks like:
Id     Moderator          Event-Type            Date-stamp

1      Monica Cellio      Fired                 Sep 27
2      Glen_b             diamond removed       Oct 9 at 0:53
3      Gung               suspending activity   Oct 18 at 1:32
4      whuber             weekly strike         Oct 18, 25, ...
Ideally I am not making the table complete because that's a lot of work for the hundreds of events but instead do something like a random sampling (e.g. digging through posts like Gung's or GlenB's or comments like Whuber's). So this must be a consideration for the model/test that I am gonna apply.
Partial result/work
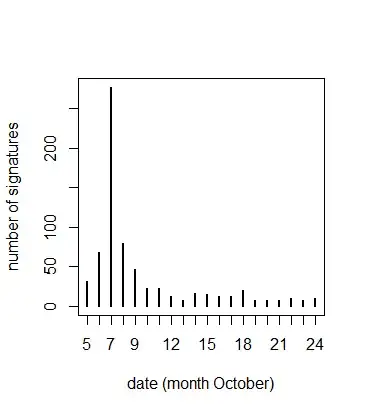
Based on the comments I did some initial parsing of the petition letter which results in the following image:
library(XML)
u <- 'https://dearstackexchange.com/'
html = htmlTreeParse(readLines(u), useInternal = TRUE)
dates = unlist(xpathApply(html, '//small', xmlValue))
dates <- text[-length(text)]  # remove final value
times <- 5+(as.numeric(strptime(dates, "%b %d")) - as.numeric(strptime("Oct 5", "%b %d")) )/24/3600
t <- table(times)
plot(t, xlab = "date (month October)", ylab = "number of signatures")
We see this peak of signatures on the 7th oktober and then a decrease. This is no surprise and relates to what gridAlien describes in his/her/their post as an intital firing. But there is still a remaining number of signatures toward the end of the month. Is this number increasing or decreasing?
