There is a good case for having a large number of bins, e.g. bins for every possible value, whenever it is suspected that the detail of a histogram would not be noise, but interesting or important fine structure.
This is not directly connected to the precise motivation for this question, wanting an automated rule for some optimum number of bins, but it is relevant to the question as a whole.
Let us leap immediately to examples. In demography rounding of reported ages is common, especially but not only in countries with limited literacy. What can happen is that many people do not know their exact date of birth, or there are social or personal reasons either for understating or for exaggerating their age. Military history is full of examples of people telling lies about their age either to avoid or to seek service in armed forces. Indeed many readers will know someone who is very coy or otherwise not quite truthful about their age, even if they do not lie about it to a census. The net result varies but as already implied is usually rounding, e.g. ages ending in 0 and 5 are much more common than ages one year less or more.
A similar phenomenon of digit preference is common even for quite different problems. With some old-fashioned measurement methods the last digit of a reported measurement has to be gauged by eye by interpolation between graduated marks. This was long standard in meteorology with mercury thermometers. It has been found that collectively some reported digits are more common than others and that individually many of us have signatures, a personal pattern of favouring some digits rather than others. The usual reference distribution here is the uniform, that is, as long as the range of possible measurements is many times greater than the "unit" of measurement, the final digits are expected to occur with equal frequency. So if reported shade temperatures could cover a range of (say) 50 $^\circ$C the ten last digits, fractions of a degree .0, .1, $\cdots$, .8, .9 should each occur with probability 0.1. The quality of this approximation should be good even for a more limited range.
Incidentally, looking at the last digits of reported data is a simple and good method of checking for fabricated data, one that is much easier to understand and less problematic than the currently fashionable scrutiny of first digits with an appeal to Benford's Law.
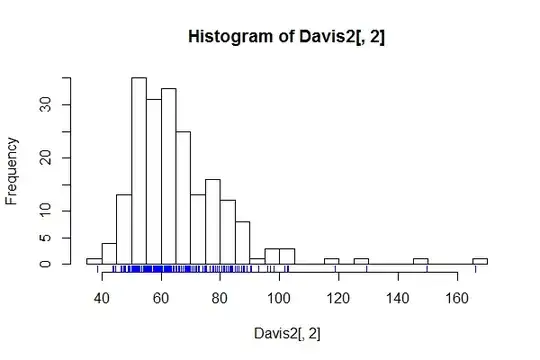
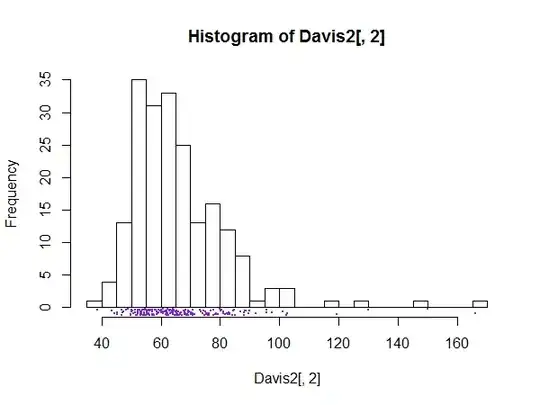
The upshot for histograms should now be clear. A spike-like presentation can serve to show, or more generally to check for, this kind of fine structure. Naturally, if nothing of interest is discernible, the graph may be of little use.
One example shows age heaping from the Ghana census for 1960. See http://www.stata.com/manuals13/rspikeplot.pdf
There was a good review of distributions of final digits in
Preece, D.A. 1981. Distributions of final digits in data. The Statistician 30: 31-60.
A note on terminology: some people write about the unique values of a variable when they would be better talking about the distinct values of a variable. Dictionaries and usage guides still advise that "unique" means occurring once only. Thus the distinct reported ages of a population could be, in years, 0, 1, 2, etc. but the great majority of those ages will not be unique to one person.