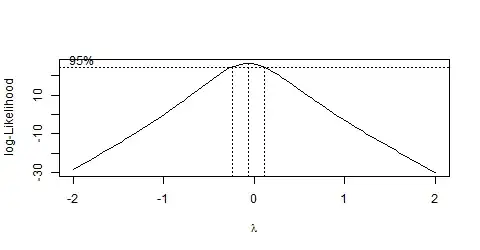
I did a box cox plot on the ozone data in R. I need to determine the best transformation. Is there a way to get the exact confidence interval for lambda and the max. lambda or by just looking at the graph to estimate.(I dont know how to paste the graph).
Asked
Active
Viewed 5,062 times
1
-
Normally such transformations are exploratory and, even when not, they tend to be limited to discrete values (multiples of $1/2$ or $1/3$ between $-1$ and $1$, typically). In such cases, "exact" confidence intervals seem of little use. Consider explaining *why* you are considering a transformation in the first place and what you are hoping to achieve with it: you might get some more useful answers that way. – whuber Nov 09 '12 at 22:44
-
My lambda is approx.=0.28 and a transformation on the response might improve the R-square and the significance of the predictors. Since lambda falls approx. between 0 and 0.5, a sqrt or higher transformation might work. – stacy Nov 09 '12 at 22:57
-
1This is just a comment, not an answer: The three chief reasons for re-expressing the response are to make the residuals homoscedastic, to linearize its relationship with the explanatory variables, and because theory suggests such a re-expression. Although you can *always* find a $\lambda$ that improves $R^2$, that's really a side-effect, not an objective, and the effect on the predictors is--unpredictable. Thus, you should be paying attention to the regression diagnostics concerning the shape of the residuals and the goodness of fit more than anything else. – whuber Nov 09 '12 at 23:44
-
A closely related thread (focusing on logarithms, but most of which is more generally applicable to nonlinear re-expressions of the response) is at http://stats.stackexchange.com/questions/298. – whuber Nov 09 '12 at 23:44
1 Answers
3
First, some example data:
library(MASS)
bc <- boxcox(Volume ~ log(Height) + log(Girth), data = trees)

To find the $\lambda$ value with the highest log-likelihood, this command could be used:
bc$x[which.max(bc$y)]

[1] -0.06060606
Sven Hohenstein
- 6,285
- 25
- 30
- 39
-
thank you for your comments and the thread was helpful. I got a better understanding than my book. – stacy Nov 09 '12 at 23:59
-
@stacy see also http://en.wikipedia.org/wiki/Power_transform#Example for an explanation of where the horizontal line comes from. – Glen_b Nov 10 '12 at 02:39