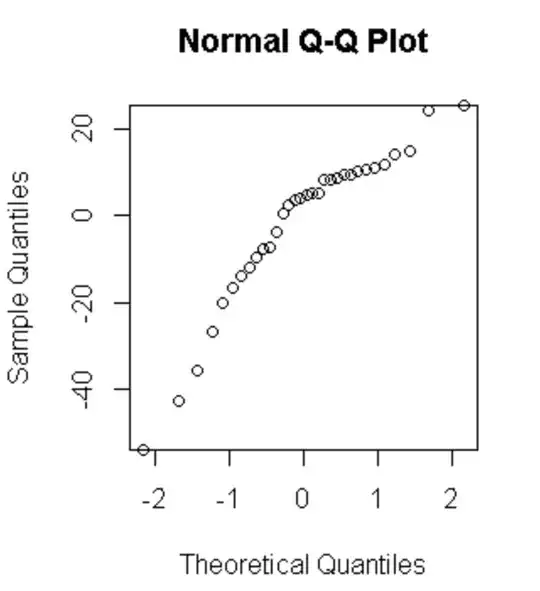
I am currently running a Shapiro-Wilk test on the residuals of a repeated ANOVA model. The repeated-measures ANOVA was conducted to measure two main effects A & B. The ANOVA summary is listed below.
    Error: X
              Df Sum Sq    Mean Sq F value Pr(>F)
    Residuals 31 127893    4126

    Error: X:A
                    Df  Sum Sq  Mean Sq  F value   Pr(>F)
                 A  1   2435    2436     7.122     0.012 *
    Residuals       31  10601    342
    ---
    Signif. codes:  0 ‘***’ 0.001 ‘**’ 0.01 ‘*’ 0.05 ‘.’ 0.1 ‘ ’ 1

    Error: X:B
                    Df   Sum Sq   Mean Sq   F value   Pr(>F)
                 B  1    362      361.6     1.915     0.176
    Residuals       31   5854     188.8

    Error: X:A:B
                     Df   Sum Sq   Mean Sq   F value    Pr(>F)
                A:B  1    548      548.3     4.164      A:B 0.0499 *
    Residuals       31    4081     131.7


    Residuals
    ---
    Signif. codes:  0 ‘***’ 0.001 ‘**’ 0.01 ‘*’ 0.05 ‘.’ 0.1 ‘ ’ 1

    Error: Within
              Df  Sum Sq  Mean Sq  F value Pr(>F)
    Residuals 64  16940   264.7
The leve's test result indicated F(3,188) = 1.0945, p = 0.3527) that there is no significant evidence to suggest that variance across groups is different.
The Shapiro-Wilk test results are
data:  aov_residuals_A
W = 0.89639, p-value = 0.005018

data:  aov_residuals_B
W = 0.97361, p-value = 0.6045

data:  aov_residuals_XY
W = 0.96834, p-value = 0.4549
Shapiro-Wilk test indicates that residuals of A are not normally distributed. But when I plot the qqnorm for the residuals, it looks similar. Is it ok if I report that the data is normally distributed based on the qqnorm or should I perform some other test other than ANOVA.
