2

I am using quantile regression forests to predict the distribution of a measure of performance in a medical context. I am using the ranger R package for that purpose.

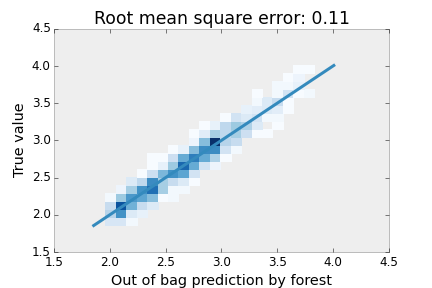
I would like to have advices about how to check that predictions are valid. If the objective is to predict the mean, any measure of OOB error or visual comparisons between OOB predictions and true values (see e.g. this plot) are possible approaches to investigate the fit. However, what should be done to investigate the validity of quantile regression? Without a proper check, it is possible that quantile regression corresponds to the distribution of the answer $Y$ values without accounting for the predictor variables $X$ (which could be meaningful if $X$ conveys no information). It is also possible that random forests return quantiles that are poor prediction of the true conditional quantiles but I would like to check that.

Richard Hardy
  • 54,375
  • 10
  • 95
  • 219
  • 1
    Welcome to CV.SE. Is there a reason why a standard reference like: "*[Goodness of fit and related inference processes for quantile regression](https://amstat.tandfonline.com/doi/abs/10.1080/01621459.1999.10473882)*" and the corresponding $R_1(\tau)$ would not be applicable to what you want? It is the "canonical" reference on the matter (most of Koenker's work is). A few R packages already implement it too (e.g.[Qtools::GOFTest](https://rdrr.io/rforge/Qtools/man/GOFTest.html)); we have a nice thread on the matter [here](https://stats.stackexchange.com/questions/129200) too. :) – usεr11852 Sep 20 '19 at 09:09
  • Thanks a lot for your answer. I should compute this GOF quantity. However, there are 2 limits I see. First, it seems a really technical quantity. I do not think my collaborators will be convinced by values about this numerical quantity they do not know about. Graphical plots about quality of prediction can be more convincing for non-experts. Second (and less important), [GOFTest](https://rdrr.io/cran/Qtools/man/GOFTest.html) only works with models such as _quantreg_ and the formula should be reimplemented for _ranger_ but that is doable. – Michael Blum Sep 20 '19 at 09:27
  • I think, the first point is a bit "erroneous" (apologies). Re-education is part of our work as researchers/scientists, new cool methods require some investment. That said, I appreciate that graphical representations are good commun. tools: we can provide graphical representations of $R_1(\tau)$ as a function (e.g. $R_1(\tau)$ vs $\tau$ plus a line for the value of value of the standard $R^2$). For point two: Yeah... That is something for [Marvin](https://github.com/imbs-hl/ranger) (or a PhD student) to sort out. The link I provided above shows the (relatively simple) calculations needed. – usεr11852 Sep 20 '19 at 09:46
  • Maybe an option is to compare predictions with those from linear quantile regression. – Michael M Sep 20 '19 at 21:53

0 Answers0