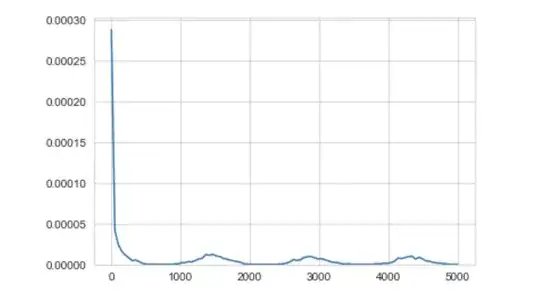
Pdf of a distribution is shown in the figure below. Is there a way to estimate the first tail (or) to segment first mode and its tail?
he KDE plot resulted from a transaction dataset where transactions occur at two frequencies - one immediately after and the other after a while. Hence the first peak. My goal is to identify transactions happening immediately after. By visualization, I found that 600 would be an optimum value for this distribution but is there any statistical way to determine this?
Edit: My goal is to segment the sub-population corresponding to the big peak around zero from the rest.