1

I have the following data stored in pandas Series:

errro
2019-08-06   -0.010112
2019-08-07    0.149606
2019-08-08    0.072981
2019-08-09   -0.028481
2019-08-13    0.016070
2019-08-14   -0.031424
2019-08-15   -0.009823
2019-08-16    0.008425
2019-08-20    0.205810
2019-08-21    0.130842
2019-08-22   -0.002020
2019-08-23   -0.174903
2019-08-27   -0.159731
2019-08-28   -0.094326
2019-08-29   -0.084832
2019-08-30   -0.228481
2019-09-03   -0.341104
2019-09-04    0.066397

I am using the following code:

import pmdarima as pm
rs_fit = pm.auto_arima(error.values, start_p=1, start_q=1, max_p=3, max_q=3, m=12,
                                   start_P=0, seasonal=False, trace=True,
                                   n_jobs=-1,  # We can run this in parallel by controlling this option
                                   error_action='ignore',  # don't want to know if an order does not work
                                   suppress_warnings=True,  # don't want convergence warnings
                                   random=True, random_state=42,
                                   n_fits=25)

rs_fit.predict(n_periods=15)

I get the following output: rs_fit.predict(n_periods=15)

Out[10]: 
array([ 0.11260974, -0.02270731, -0.02270731, -0.02270731, -0.02270731,
       -0.02270731, -0.02270731, -0.02270731, -0.02270731, -0.02270731,
       -0.02270731, -0.02270731, -0.02270731, -0.02270731, -0.02270731])

I am not sure I understand the repetitions of errors after step 1.

Edit: When I change the above to:

modl = auto_arima(error.values, start_p=1, start_q=1, start_P=1, start_Q=1,
                              max_p=5, max_q=5, max_P=5, max_Q=5, seasonal=False,
                              stepwise=True, suppress_warnings=True, D=10, max_D=10,
                              error_action='ignore')

The results are drastically different:

Out[26]: 
array([-0.17272289, -0.18657458, -0.20042626, -0.21427794, -0.22812963,
       -0.24198131, -0.255833  , -0.26968468, -0.28353636, -0.29738805,
       -0.31123973, -0.32509141, -0.3389431 , -0.35279478, -0.36664646])

Edit2: What size of error series should I for 15 periods ahead forecast? Is there any guideline to it? And how else can I improve the model fit above ?
user1243255
  • 411
  • 4
  • 14
  • 2
    Why do you believe there is an error? – Stephan Kolassa Sep 04 '19 at 19:56
  • (1) It doesnt smell right (2) When I change the input variables the results change significantly as illustrated in the edit – user1243255 Sep 04 '19 at 20:19
  • 4
    (1) "it doesn't smell right" is not overly informative. What output would you *expect*? (2) Why are you surprised that the output changes if you change the input? I assume the fitted model form changed (not only the parameter estimates). – Stephan Kolassa Sep 04 '19 at 20:21
  • So, there is no expectation of result stability ? Or what should I do to make the result stable ? – user1243255 Sep 04 '19 at 20:22
  • 2
    This is such a short series and you are implicitly using so many potential parameters I wouldn't expect anything to be "stable:" you should be able to fit a variety of hugely different models to it. – whuber Sep 04 '19 at 20:24
  • What do you mean by "stable"? If I understand this correctly, then your second model *forces* starting with a seasonal ARIMA (`start_P=1, start_Q=1`). This is not a natural starting point for fitting models, and I am not surprised it yields a different final model. – Stephan Kolassa Sep 04 '19 at 20:25
  • Can you please suggest improvements to my model as I do not have experience and seems I am missing a lot of your points as to what is the solution that I should be implementing instead of what I have ? – user1243255 Sep 04 '19 at 20:27
  • 1
    your data (18 values) is not equally spaced .. it has systematic gaps of missing 3 readings. . Are observations only available for 4 days of the week ? perhaps your "frequency/seasonality" should be 4. – IrishStat Sep 04 '19 at 20:40
  • If I replace error with error.values it doesnt make a difference in the result – user1243255 Sep 04 '19 at 20:41

1 Answers1

3

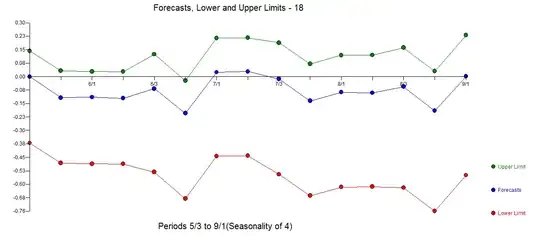
I took your 18 values and identified a 5 parameter model (shocking to some ! ) ofenter image description here the form with Actual/Fit and Forecast here enter image description here. All models are wrong .. some models are useful ...

The reason for auto.arima getting confused is perhaps due to the presence of the untreated downwards level shift at reading 11 and the unusual value at period 17.

In general I followed a more general (iterative ) paradigm https://autobox.com/pdfs/ARIMA%20FLOW%20CHART.pdf closely following the model identification process suggested by Box and Jenkins extended to simultaneously consider the impact of latent deterministic structure as suggested here http://docplayer.net/12080848-Outliers-level-shifts-and-variance-changes-in-time-series.html . What follows is an excellent example case of what is referred to as Exploratory Data Analysis where hypothesis are found that are the least defensible such as "There is no level shift in the series at any point in time" leading to a model modifcation suggesting an optimal alternative hypothesis "There is a level shift in the series at point 11".

The original acf.pacf is here enter image description here and the suggested model was an AR(1) OR (1,0,0)(0,0,0)4 enter image description here .

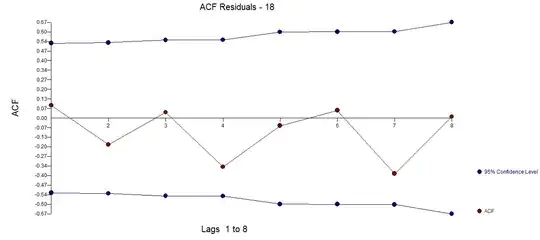
The residuals from this model were examined to suggest possible model revision

enter image description here yielding the suggestion that 3 dummy indicators might be helpful ( a pulse .. a level shift and a seasonal pulse ) enter image description here

Note well that a simple review of the plot of the series would have suggested this level shift enter image description here which AUTOBOX found iteratively.

yielding this augmented model enter image description here .

Residual diagnostic checking of this model enter image description here uncovered the need for a seasonal ar term thus the tentative model is now (1,0,0)(1,0,0)4 enter image description here

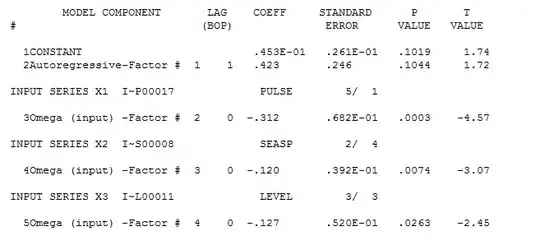
Parsimony suggested deleting the now non-significant ar(1) term and reducing it to the final model enter image description here

with statistics here enter image description here

Model identification with 18 values including a level shift and possible seasonal structure can't be handled with a simple search solution based upon a set of pure arima ( no pulses, no level shifts , no seasonal pulses , no local time trends ) as these factors often are present in the data we analyze.

The formal reason came from @ADAM0 here Interrupted Time Series Analysis - ARIMAX for High Frequency Biological Data? where he highlighted that untreated deterministic structure CONFUSES pure memory driven solutions.

I used a piece of software called AUTOBOX which I have helped to develop to automatically reduce the 18 observations to signal and noise enter image description here.

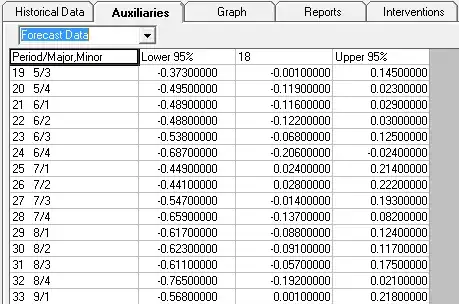
as the OP had requested these are enter image description herethe forecasts for the next 15 periods and here enter image description here. To be compared to the much higher auto.arima forecasts

   -0.17272289, -0.18657458, -0.20042626, -0.21427794, -0.22812963,
   -0.24198131, -0.255833  , -0.26968468, -0.28353636, -0.29738805,
   -0.31123973, -0.32509141, -0.3389431 , -0.35279478, -0.36664646]
IrishStat
  • 27,906
  • 5
  • 29
  • 55
  • "some models are useful ". How do you identify this and what does your auto_arima setup look like ? – user1243255 Sep 04 '19 at 20:58
  • 2
    This is a great explanation for sure and I have read it multiple times but I am not sure it answers the original question related to auto_arima. I do not have access to AUTOBOX . – user1243255 Sep 04 '19 at 22:17
  • auto.aroma tries a fixed set of models and computes a statistic which is then the basis of model selection. This strategy works if there is no latent deterministic structure AND the selected model has constant parameters over time and constant error variance over time. If this is not true then the degree of failure of auto.arima to identify the model can be significant. In this case the first pass of AUTOBOX where it developed the (1,0,0,)(0,0,0) model would probably be the same as auto.aroma identified IFF the seasonality/frequency was specified as 4 . I am not a fan of auto.arima ..so I pass – IrishStat Sep 04 '19 at 22:59
  • I count 8 parameters, because you also had to determine the times of those pulses and level shifts. For 18 data points that is indeed quite a lot of parameters. – whuber Sep 04 '19 at 23:01
  • 1
    as to availablilty of AUTOBOX , i gave you the source articles which you can then use to reproduce the results I delivered. The message here is model identification * i.e. separating the observed series to sifnal and noise ) is like "peeling an onion where you constantly have referebce to the Gaussian assumptions and parsimony. – IrishStat Sep 04 '19 at 23:03
  • 1
    18 observations .. 14 estimable equations .. 5 parameters i.e. .101 , -.799 , -.4 , -.13 and -.0942 degrees of freedom = 9 i.e. 14-5 . I am not sure where the term comes from ? determining the times ? a search process was conducted to evaluate the potentially most important structures , their type and the date of the occurrences. – IrishStat Sep 04 '19 at 23:06
  • 1
    your forecasts from your first run reflect/suggest an ma(1) process as all forecasts are the same after period 1..suggesting an auto.arima model of (0,1,1)(0,0,0) – IrishStat Sep 05 '19 at 10:05
  • your forecasts from the second run a suggests a random walk model with drift (0,1,0) which reflects the omission of the needed level shift and uses the downward shift in mean at period 11 as the justification for a permanent downwards trend. Not so good ! . It appears that the longer scan ( maxp =5 and maxq =5 ) overcame problem 1 to create problem 2 . Discerning between deterministic structure and stochastic structure is critical in model identification. – IrishStat Sep 05 '19 at 11:07
  • Just because you found the three special times through a search instead of some other procedure does not eliminate the need to account for them in assessing the parsimony of your model. It is prudent to account for *everything* you estimate, for otherwise your forecast ranges will be too narrow. – whuber Sep 05 '19 at 15:23
  • the discarded options are never part of the estimated model .. their evaluation is done on solely on a prospective basis ...thus not to worry . Only the estimated coefficients come into play in the final model thus the uncertainty is solely based on the final model and not impacted at all by the exploratory data analyses/activities. – IrishStat Sep 05 '19 at 17:57