5

I have some data that looks like this:

enter image description here

Procrastinator has come up with one good suggestion for how to test hypotheses under this distribution, but it relies on some guesswork to fit constants. I would therefore feel more comfortable if I had multiple methods, and could check that they all agreed.

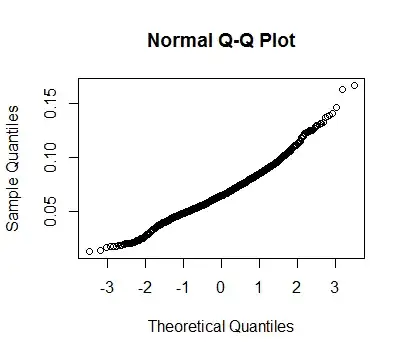
One thing I can do is find the mean of a bunch of samples, and by CLT this will approximate the normal distribution. In fact, this happens at reasonably small sample sizes. Here is my data with 1000 samples (with replacement) of 100 points each:

histogram

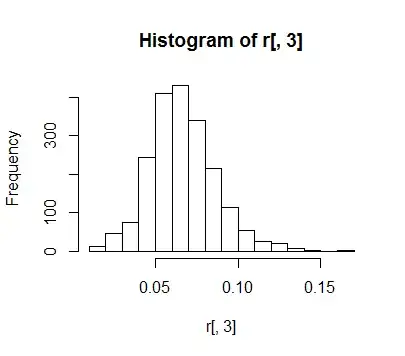
It looks fairly normal:

qq

So would it be acceptable for me to compare two groups by first transforming them into a set of samples, and then using e.g. a T-test? Or am I introducing an unknown bias here?

(In this modified form, comparing their means does seem to be a useful metric, so I think a t test is good from that perspective.)

Xodarap
  • 2,448
  • 2
  • 17
  • 24
  • 3
    Which hypothesis do you really want to test? When you average many samples, you are throwing information away so that all that is left is a roughly normal distribution which is only described by $2$ parameters. It's quite possible that you could start with enough information to distinguish $X$ from $Y$, perhaps you can tell that $P(X=0) \ne P(Y=0)$, but that you lose this ability by averaging samples. – Douglas Zare Nov 05 '12 at 21:23
  • @Douglas: This is a good point. But I do want to test whether their means differ, so I think I am OK? – Xodarap Nov 05 '12 at 23:29
  • 1
    If $X=X(\alpha)$ is not normal and is from some parametrized family, then you may lose information. The mean is not always a sufficient statistic. http://en.wikipedia.org/wiki/Sufficient_statistic – Douglas Zare Nov 06 '12 at 03:40
  • 2
    It is not clear which statistical principles are being invoked. I'm not aware of any that support this strategy. – Frank Harrell Mar 08 '14 at 14:33

1 Answers1

1

"Defects" is presumably a count variable.

The first thing that comes to mind would be a GLM; depending on circumstances I'd start by considering a binomial, Poisson, quasi-Poisson or negative binomial model (or possibly a zero-inflated version of one of those).

Those models can all deal with skewed data, including (in some cases) highly skewed data.

If you're looking at averages, normality isn't your only problem to consider - count variables tend to be heteroskedastic as well. The above GLMs are able to handle the kinds of heteroskedasticity that most often tend to occur with count data.

These will allow you to fit models that allow a test for a comparison of means as well as more complicated models.

Glen_b
  • 257,508
  • 32
  • 553
  • 939
  • 3
    Other alternatives worth considering are the class of cumulative probability semiparametric models, including the proportional odds and proportional hazards (log-log link) models. – Frank Harrell Mar 08 '14 at 14:34