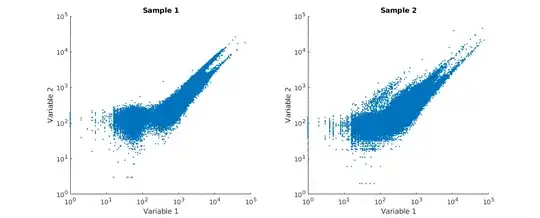
I have data (with ~50,000 data points) that consists of measurement of two variables.
I wanted to see how "spread out" the scatterplot of each sample is i.e. variance in all (2) dimensions. You can see that the scatter of Sample 2 is more broad. If I simply compare the univariate variances, then I may not see any difference between the two samples (as the data points are just projections in one dimension). To give you a context, these data points denote activity of a protein in two different tasks. Each dot would denote a combination of the two traits. I want to know what is the diversity of these combinations i.e. the area of "activity space" covered by different samples.
This post, A measure of "variance" from the covariance matrix?, suggests different metrics such as trace or the kth root of the determinant of the covariance matrix. I was also considering using the determinant (product of eigenvalues) as it would somewhat represent the total area covered by the data.
If I do use $|\Sigma|^k$ what would be an appropriate statistical test to compare two samples (analogous to F-test)?
