I have a list of probabilities outputted by a classifier on a balanced dataset. The metric I want to maximize is accuracy ($\frac{TP+TN}{P+N}$). Is there a way to calculate the best threshold (without iterating over many threshold values an selecting the best one), given the probabilities and their true labels.
-
6Do not use accuracy to evaluate a classifier: [Why is accuracy not the best measure for assessing classification models?](https://stats.stackexchange.com/q/312780/1352) [Is accuracy an improper scoring rule in a binary classification setting?](https://stats.stackexchange.com/q/359909/1352) [Classification probability threshold](https://stats.stackexchange.com/q/312119/1352). That said, it's an interesting theoretical question. – Stephan Kolassa Jul 16 '19 at 11:59
3 Answers
I suspect that the answer is "no", i.e., that there is no such way.
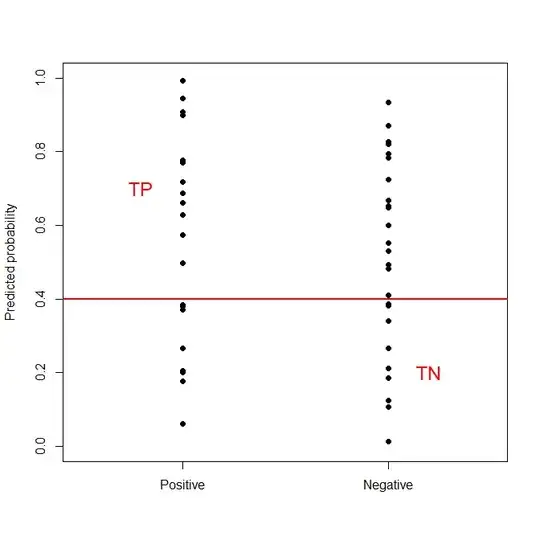
Here is an illustration, where we plot the predicted probabilities against the true labels:
Since the denominator $P+N$ in the formula for accuracy does not change, what you are trying to do is to shift the horizontal red line up or down (the height being the threshold you are interested in) in order to maximize the number of "positive" dots above the line plus the number of "negative" dots below the line. Where this optimal line lies depends entirely on the shape of the two point clouds, i.e., the conditional distribution of the predicted probabilities per true label.
Your best bet is likely a bisection search.
That said, I recommend you look at
- 95,027
- 13
- 197
- 357
Agreeing with @StephanKolassa, I'll just look from an algorithmic perspective. You'll need to sort your samples with respect to produced probabilities, which is $O(n\log n)$, if you've $n$ data samples. Then, your true class labels will order like $$0\ 0 \ 1\ 0\ 0\ 1 \ ...\ 1 \ 1\ 0\ 1 $$ Then, we'll put a separator $|$ at some position in this array; this'll represent your threshold. At most there are $n+1$ positions to put it. Even if you calculate the accuracy for each of these positions, you won't be worse than the sorting complexity. After getting the maximum accuracy, the threshold may just be chosen as the average of the neighboring samples.
- 49,700
- 3
- 39
- 75
I implemented the solution proposed by Stephan Kolassa in python:
def opt_threshold_acc(y_true, y_pred):
    A = list(zip(y_true, y_pred))
    A = sorted(A, key=lambda x: x[1])
    total = len(A)
    tp = len([1 for x in A if x[0]==1])
    tn = 0
    th_acc = []
    for x in A:
        th = x[1]
        if x[0] == 1:
            tp -= 1
        else:
            tn += 1
        acc = (tp + tn) / total
        th_acc.append((th, acc))
    return max(th_acc, key=lambda x: x[1])
- 11
- 2
-
1The comments from @Sycorax yesterday still apply. I do think, however, that this could be a valuable statistical contribution if you give some explanation of your code, either in comments or as a paragraph. For instance, what does that lambda function do? That might not be obvious to someone who uses R or SAS. – Dave Jul 31 '21 at 19:51
