2

I am currently doing a project on Load forecasting and it is known that in my country the temperature effects the load.

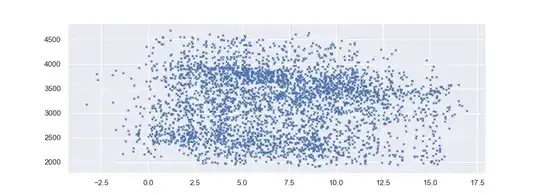
I have hourly readings of Load and Temperature from the period between 01-Oct-2014 to 01-Mar-2014. Using python I read in the data and plotted Load against Temperature and found that there was no correlation. I know that my data has been collected into the dataframe correctly. I wish to use weather as a variable in order to calculate the load for tomorrow, however I am unsure how this can be done if there is no correlation.

If it is 'known' that weather affects load but there is no visible correlation between them, are there any other ways where I can analyse the pattern between them in order to utilize weather in my load forecast, or does this mean that they are simply not related?

Below is my plot, Load on the y axis, in Mega-Watts and Temperature on the x axis, in degrees celcius.

enter image description here

Below is my code:

plt.plot('Temp','Load',data=df,linestyle='',marker='x',markersize=3)
Matthew
  • 123
  • 4
  • 1
    Isn't there a small negative correlation? – David Jun 28 '19 at 11:07
  • 2
    Is the load from the same time of day each time? It looks like there are two prominent groups, perhaps one is daytime and one nighttime, reflecting different needs at different times of the day – ReneBt Jun 28 '19 at 11:23
  • @David a tiny bit, but individuals who override the current forecast system manually say that temperature has a big influence. – Matthew Jun 28 '19 at 11:29
  • 1
    @ReneBt Interesting,no the data is taken at all times, I must have a look at the data at certain times. More generally, could this happen because there is another variable which is not being controlled, in this case being time of the day? – Matthew Jun 28 '19 at 11:30
  • It looks that the data, if correct, is very noisy. Are there other variables that should be taken into account? – David Jun 28 '19 at 11:33
  • @David in light of ReneBT comment I analysed the data at 1pm each day and a much stronger negative correlation has shown. I am currently looking for more variables. Thanks – Matthew Jun 28 '19 at 11:42
  • Although these data may be noisy, a suitable running mean might be quite revealing: it is possible that short-term variations in load would quickly balance out over the course of just a few hours. – whuber Jun 28 '19 at 18:21

1 Answers1

2

As others here have intimated , scatter plots between the original series can often be useful but of MORE IMPORTANCE is scatter plots conditional on data conditioned for temporal activities. Often one needs to allow for hourly or daily effects (be they stochastic or deterministic ) and latent level shifts/time trends in order to tease out (identify) useful predictor structure for user specified causal variables.

Removing seasonality from a dataset where each 24 hour period of a day is normally or bimodally distributed might also be enlightening/informative leading to models that are hourly based BUT incorporating calendar effects (e.f. daily , day-of-the-month , week-of-the=month et al ).

Additionally it is usually preferable to use degree days as a predictor as high demand can be related to both cold and hot temperatures/weather.

Additionally anomalies need to be identified and conditioned for in order to clearly /identify/measure the effect of user-specified predictors.

Take a look at my response to similar questions https://stats.stackexchange.com/search?tab=newest&q=user%3a3382%20hourly%20data particularly Time Series Analysis for a Newbie .

If you wish you can post your data in a csv format , I might be able to help further.

IrishStat
  • 27,906
  • 5
  • 29
  • 55