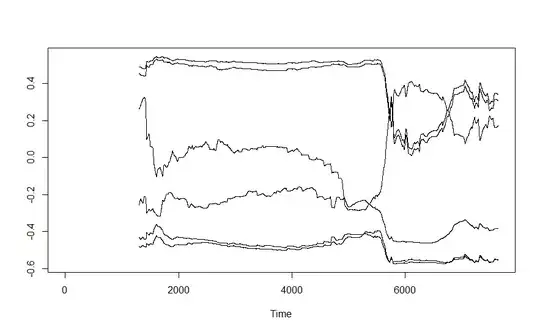
I have six UK inflation time series, starting from Jan 1990 and ending in June 2019. These series as standardized on an expanding window and subsequently forward filled. I use these series to run a PCA on an expanding window size (initial data has 1300 observations). I expand this window size every time by one day. For all these inflation series I compute the factor loading at every date (day) t. I plot the Factor loadings below:
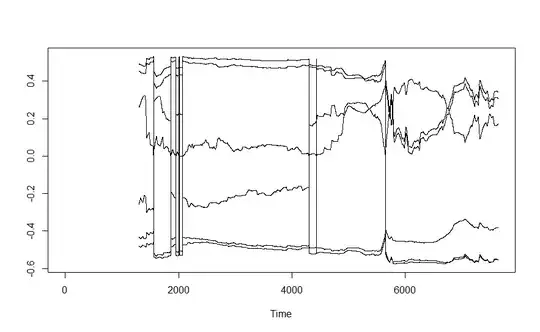
However, now I re-run the analysis and I switch the third column (time series 3) with the first column (time series 1). My factor loadings now behave totally different and I obtain jumpy sign reversals now. I show the new factor loadings below:
The time series stay the same. They start at the same time and do not contain missing values / NA's or whatever. I only switch the order of the columns.
My questions: 1) Why does the order of the columns impact the PCA Factor Loadings results? 2) How do I deal with such jumps in factor loadings and, especially, avoid them?
I am using the princomp command in R to determine the factor loadings. I hope someone can help me out, because I am really stuck on this matter.

