Aha, excellent question!!
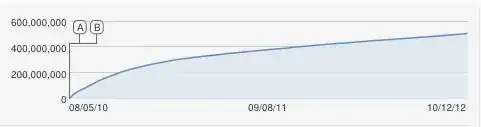
I would also have naively proposed an S-shaped logisitic curve, but this is obviously a poor fit. As far as I know, the constant increase is an approximation because YouTube counts the unique views (one per IP address), so there cannot be more views than computers.
We could use an epidemiological model where people have different susceptibility. To make it simple, we could divide it in the high risk group (say the children) and the low risk group (say the adults). Let's call $x(t)$ the proportion of "infected" children and $y(t)$ the proportion of "infected" adults at time $t$. I will call $X$ the (unknown) number of individuals in the high risk group and $Y$ the (also unknown) number of individuals in the low risk group.
$$\dot{x}(t) = r_1(x(t)+y(t))(X-x(t))$$
$$\dot{y}(t) = r_2(x(t)+y(t))(Y-y(t)),$$
where $r_1 > r_2$. I don't know how to solve that system (maybe @EpiGrad would), but looking at your graphs, we could make a couple of simplifying assumptions. Because the growth does not saturate, we can assume that $Y$ is very large and $y$ is small, or
$$\dot{x}(t) = r_1x(t)(X-x(t))$$
$$\dot{y}(t) = r_2x(t),$$
which predicts linear growth once the high risk group is completely infected. Note that with this model there is no reason to assume $r_1 > r_2$, quite the contrary because the large term $Y-y(t)$ is now subsumed in $r_2$.
This system solves to
$$x(t) = X \frac{C_1e^{Xr_1t}}{1 + C_1e^{Xr_1t}}$$
$$y(t) = r_2 \int x(t)dt + C_2 = \frac{r_2}{r_1} \log(1+C_1e^{Xr_1t})+C_2,$$
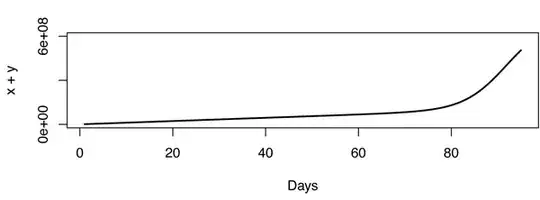
where $C_1$ and $C_2$ are integration constants. The total "infected" population is then
$x(t) + y(t)$, which has 3 parameters and 2 integration constants (initial conditions). I don't know how easy it would be to fit...
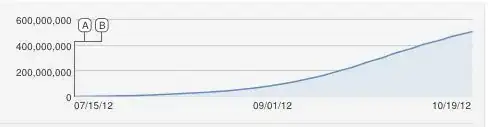
Update: playing around with the parameters, I could not reproduce the shape of the top curve with this model, the transition from $0$ to $600,000,000$ is always sharper than above. Continuing with the same idea, we could again assume that there are two kinds of Internet users: the "sharers" $x(t)$ and the "loners" $y(t)$. The sharers infect each other, the loners bump into the video by chance. The model is
$$\dot{x}(t) = r_1x(t)(X-x(t))$$
$$\dot{y}(t) = r_2,$$
and solves to
$$x(t) = X \frac{C_1e^{Xr_1t}}{1 + C_1e^{Xr_1t}}$$
$$y(t) = r_2 t+C_2.$$
We could assume that $x(0) = 1$, i.e. that there is only patient 0 at $t=0$, which yields $C_1 = \frac{1}{X-1} \approx \frac{1}{X}$ because $X$ is a large number. $C_2 = y(0)$ so we can assume that $C_2 = 0$. Now only the 3 parameters $X$, $r_1$ and $r_2$ determine the dynamics.
Even with this model, it seems that the inflection is very sharp, it is not a good fit so the model must be wrong. That makes the problem very interesting actually. As an example, the figure below was built with $X = 600,000,000$, $r_1 = 3.667 \cdot 10^{-10}$ and $r_2 = 1,000,000$.
Update: From the comments I gathered that Youtube counts views (in its secret way) and not unique IPs, which makes a big difference. Back to the drawing board.
To keep it simple, let's assume that the viewers are "infected" by the video. They come back to watch it regularly, until they clear the infection. One of the simplest models is the SIR (Susceptible-Infected-Resistant) which is the following:
$$\dot{S}(t) = -\alpha S(t)I(t)$$
$$\dot{I}(t) = \alpha S(t)I(t) - \beta I(t)$$
$$\dot{R}(t) = \beta I(t)$$
where $\alpha$ is the rate of infection and $\beta$ is the rate of clearance. The total view count $x(t)$ is such that $\dot{x}(t) = kI(t)$, where $k$ is the average views per day per infected individual.
In this model, the view count starts increasing abruptly some time after the onset of the infection, which is not the case in the original data, perhaps because videos also spread in a non viral (or meme) way. I am no expert in estimating the parameters of the SIR model. Just playing with different values, here is what I came up with (in R).
S0 = 1e7; a = 5e-8; b = 0.01 ; k = 1.2
views = 0; S = S0; I = 1;
# Exrapolate 1 year after the onset.
for (i in 1:365) {
   dS = -a*I*S;
   dI = a*I*S - b*I;
   S = S+dS;
   I = I+dI;
   views[i+1] = views[i] + k*I
}
par(mfrow=c(2,1))
plot(views[1:95], type='l', lwd=2, ylim=c(0,6e8))
plot(views, type='n', lwd=2)
lines(views[1:95], type='l', lwd=2)
lines(96:365, views[96:365], type='l', lty=2)
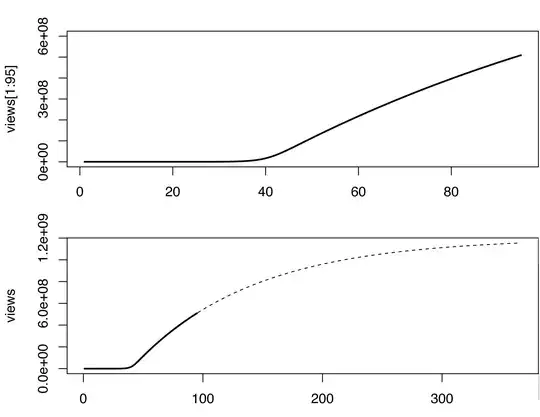
The model is obviously not perfect, and could be complemented in many sound ways. This very rough sketch predicts a billion views somewhere around March 2013, let's see...